Mongolian vs Seminole Householder Income Ages 25 - 44 years
COMPARE
Mongolian
Seminole
Householder Income Ages 25 - 44 years
Householder Income Ages 25 - 44 years Comparison
Mongolians
Seminole
$104,578
HOUSEHOLDER INCOME AGES 25 - 44 YEARS
99.6/ 100
METRIC RATING
69th/ 347
METRIC RANK
$76,584
HOUSEHOLDER INCOME AGES 25 - 44 YEARS
0.0/ 100
METRIC RATING
329th/ 347
METRIC RANK
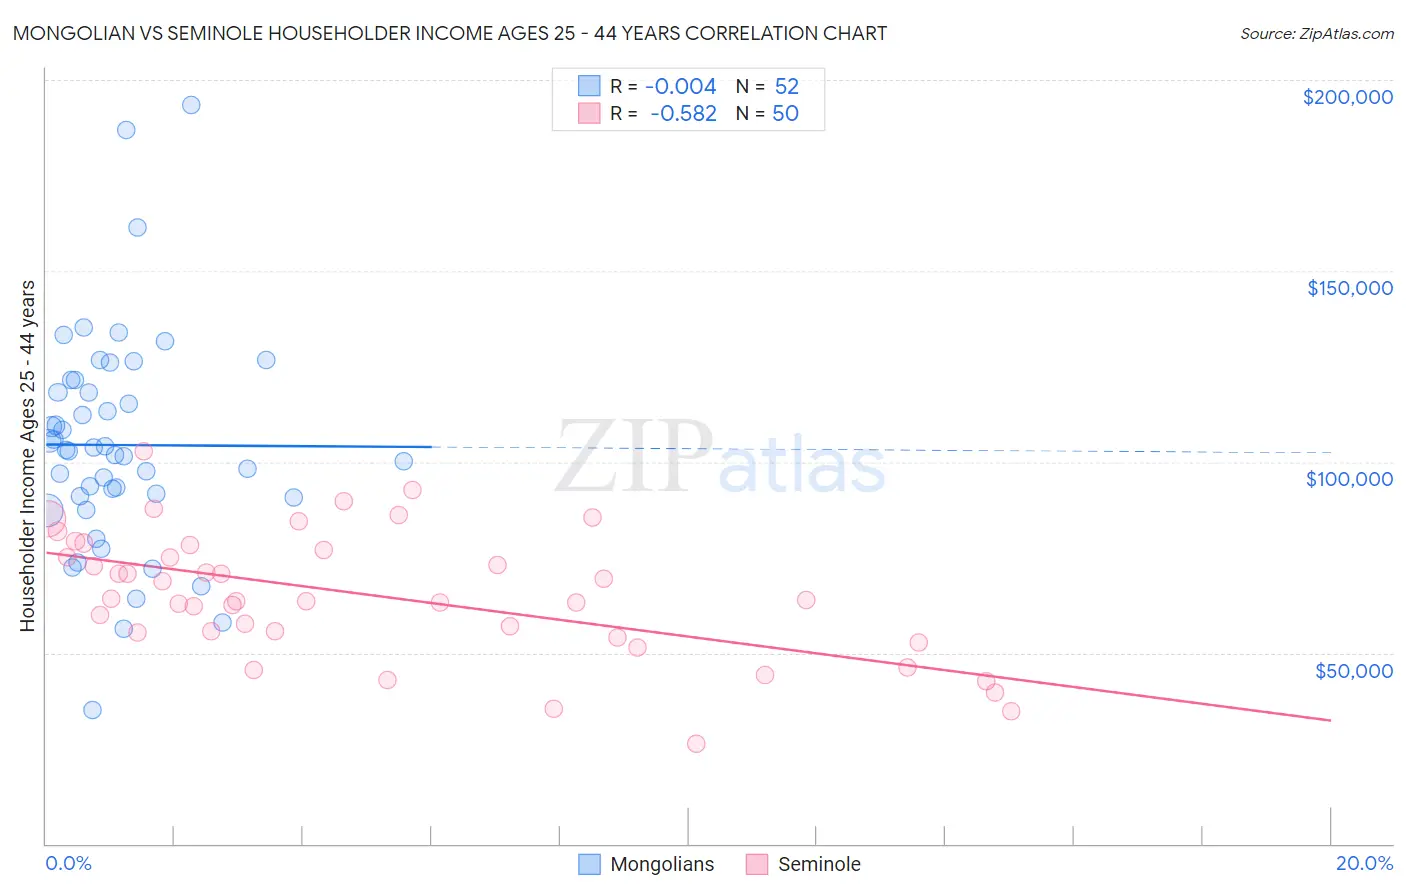
Mongolian vs Seminole Householder Income Ages 25 - 44 years Correlation Chart
The statistical analysis conducted on geographies consisting of 140,220,611 people shows no correlation between the proportion of Mongolians and household income with householder between the ages 25 and 44 in the United States with a correlation coefficient (R) of -0.004 and weighted average of $104,578. Similarly, the statistical analysis conducted on geographies consisting of 118,219,857 people shows a substantial negative correlation between the proportion of Seminole and household income with householder between the ages 25 and 44 in the United States with a correlation coefficient (R) of -0.582 and weighted average of $76,584, a difference of 36.5%.
Householder Income Ages 25 - 44 years Correlation Summary
| Measurement | Mongolian | Seminole |
| Minimum | $34,868 | $26,250 |
| Maximum | $193,482 | $102,754 |
| Range | $158,614 | $76,504 |
| Mean | $104,434 | $65,024 |
| Median | $103,048 | $63,631 |
| Interquartile 25% (IQ1) | $90,782 | $55,292 |
| Interquartile 75% (IQ3) | $119,894 | $76,875 |
| Interquartile Range (IQR) | $29,113 | $21,583 |
| Standard Deviation (Sample) | $29,028 | $16,561 |
| Standard Deviation (Population) | $28,748 | $16,395 |
Similar Demographics by Householder Income Ages 25 - 44 years
Demographics Similar to Mongolians by Householder Income Ages 25 - 44 years
In terms of householder income ages 25 - 44 years, the demographic groups most similar to Mongolians are Immigrants from Croatia ($104,503, a difference of 0.070%), Immigrants from Eastern Europe ($104,662, a difference of 0.080%), Immigrants from Romania ($104,713, a difference of 0.13%), Afghan ($104,410, a difference of 0.16%), and Chinese ($104,264, a difference of 0.30%).
| Demographics | Rating | Rank | Householder Income Ages 25 - 44 years |
| Immigrants | Italy | 99.7 /100 | #62 | Exceptional $105,201 |
| Immigrants | Scotland | 99.7 /100 | #63 | Exceptional $105,089 |
| New Zealanders | 99.7 /100 | #64 | Exceptional $105,085 |
| Immigrants | Netherlands | 99.7 /100 | #65 | Exceptional $105,082 |
| Laotians | 99.7 /100 | #66 | Exceptional $104,993 |
| Immigrants | Romania | 99.6 /100 | #67 | Exceptional $104,713 |
| Immigrants | Eastern Europe | 99.6 /100 | #68 | Exceptional $104,662 |
| Mongolians | 99.6 /100 | #69 | Exceptional $104,578 |
| Immigrants | Croatia | 99.6 /100 | #70 | Exceptional $104,503 |
| Afghans | 99.6 /100 | #71 | Exceptional $104,410 |
| Chinese | 99.5 /100 | #72 | Exceptional $104,264 |
| Italians | 99.5 /100 | #73 | Exceptional $104,215 |
| Immigrants | Fiji | 99.5 /100 | #74 | Exceptional $103,954 |
| Koreans | 99.4 /100 | #75 | Exceptional $103,824 |
| Immigrants | Spain | 99.4 /100 | #76 | Exceptional $103,752 |
Demographics Similar to Seminole by Householder Income Ages 25 - 44 years
In terms of householder income ages 25 - 44 years, the demographic groups most similar to Seminole are Immigrants from Cuba ($76,701, a difference of 0.15%), Immigrants from Bahamas ($76,910, a difference of 0.42%), Yakama ($76,226, a difference of 0.47%), Houma ($77,044, a difference of 0.60%), and Sioux ($77,089, a difference of 0.66%).
| Demographics | Rating | Rank | Householder Income Ages 25 - 44 years |
| Chickasaw | 0.0 /100 | #322 | Tragic $77,929 |
| Immigrants | Honduras | 0.0 /100 | #323 | Tragic $77,328 |
| Dutch West Indians | 0.0 /100 | #324 | Tragic $77,260 |
| Sioux | 0.0 /100 | #325 | Tragic $77,089 |
| Houma | 0.0 /100 | #326 | Tragic $77,044 |
| Immigrants | Bahamas | 0.0 /100 | #327 | Tragic $76,910 |
| Immigrants | Cuba | 0.0 /100 | #328 | Tragic $76,701 |
| Seminole | 0.0 /100 | #329 | Tragic $76,584 |
| Yakama | 0.0 /100 | #330 | Tragic $76,226 |
| Natives/Alaskans | 0.0 /100 | #331 | Tragic $75,647 |
| Bahamians | 0.0 /100 | #332 | Tragic $75,395 |
| Hopi | 0.0 /100 | #333 | Tragic $75,002 |
| Creek | 0.0 /100 | #334 | Tragic $74,847 |
| Kiowa | 0.0 /100 | #335 | Tragic $74,776 |
| Yup'ik | 0.0 /100 | #336 | Tragic $73,688 |