Mongolian vs Northern European Per Capita Income
COMPARE
Mongolian
Northern European
Per Capita Income
Per Capita Income Comparison
Mongolians
Northern Europeans
$49,173
PER CAPITA INCOME
99.8/ 100
METRIC RATING
74th/ 347
METRIC RANK
$47,698
PER CAPITA INCOME
98.9/ 100
METRIC RATING
89th/ 347
METRIC RANK
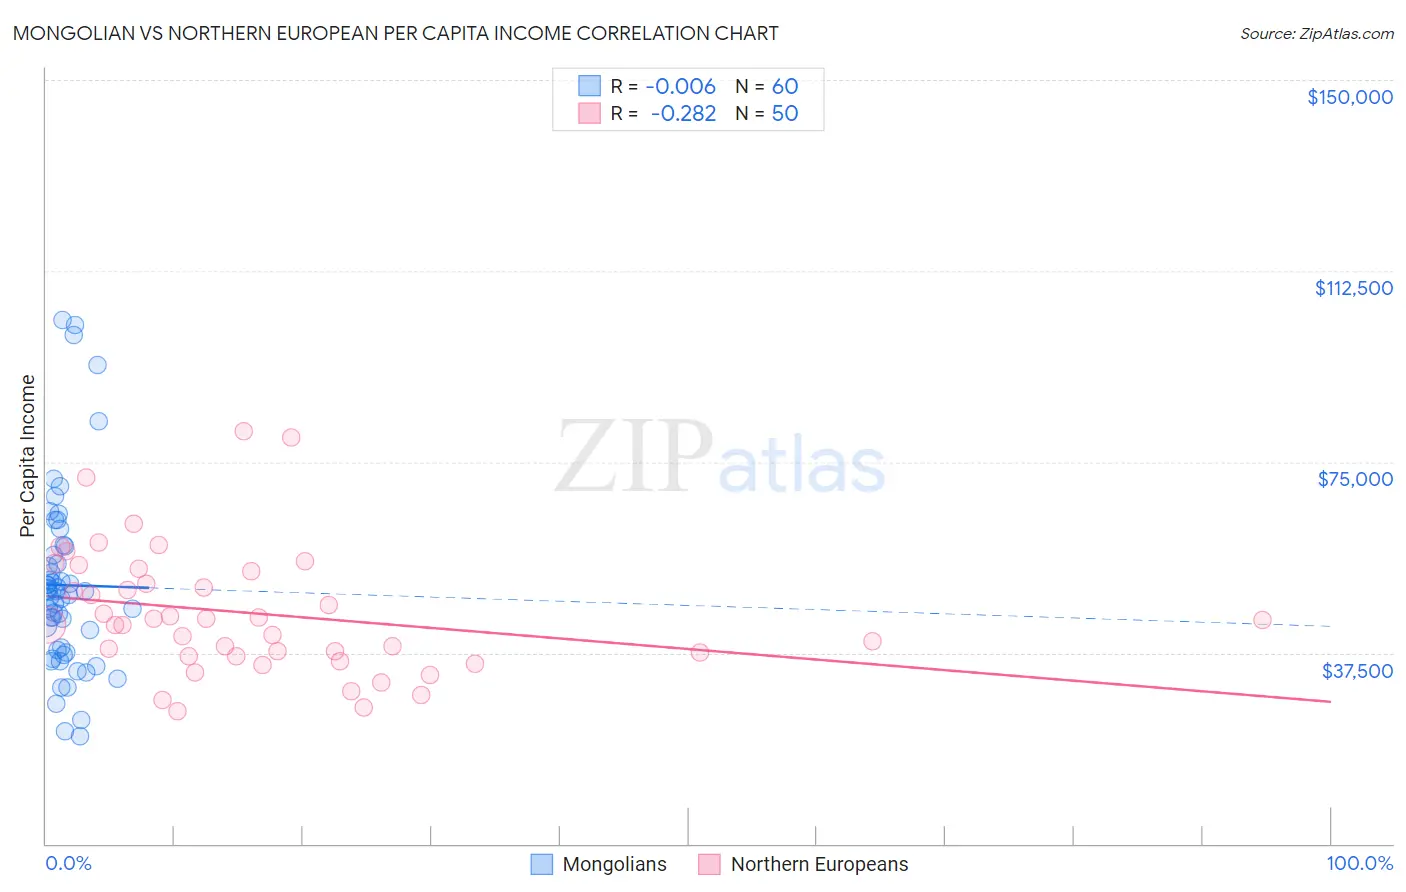
Mongolian vs Northern European Per Capita Income Correlation Chart
The statistical analysis conducted on geographies consisting of 140,356,705 people shows no correlation between the proportion of Mongolians and per capita income in the United States with a correlation coefficient (R) of -0.006 and weighted average of $49,173. Similarly, the statistical analysis conducted on geographies consisting of 406,105,495 people shows a weak negative correlation between the proportion of Northern Europeans and per capita income in the United States with a correlation coefficient (R) of -0.282 and weighted average of $47,698, a difference of 3.1%.
Per Capita Income Correlation Summary
| Measurement | Mongolian | Northern European |
| Minimum | $21,025 | $26,062 |
| Maximum | $102,845 | $80,940 |
| Range | $81,820 | $54,878 |
| Mean | $50,803 | $45,254 |
| Median | $49,216 | $43,430 |
| Interquartile 25% (IQ1) | $37,778 | $36,923 |
| Interquartile 75% (IQ3) | $57,579 | $53,441 |
| Interquartile Range (IQR) | $19,802 | $16,518 |
| Standard Deviation (Sample) | $18,159 | $12,375 |
| Standard Deviation (Population) | $18,007 | $12,250 |
Demographics Similar to Mongolians and Northern Europeans by Per Capita Income
In terms of per capita income, the demographic groups most similar to Mongolians are Immigrants from Hungary ($49,303, a difference of 0.26%), Immigrants from North America ($49,302, a difference of 0.26%), Greek ($49,309, a difference of 0.28%), Immigrants from Bolivia ($48,970, a difference of 0.41%), and Immigrants from England ($48,844, a difference of 0.67%). Similarly, the demographic groups most similar to Northern Europeans are Croatian ($47,742, a difference of 0.090%), Italian ($47,574, a difference of 0.26%), Macedonian ($47,573, a difference of 0.26%), Ukrainian ($48,014, a difference of 0.66%), and Immigrants from Southern Europe ($48,027, a difference of 0.69%).
| Demographics | Rating | Rank | Per Capita Income |
| Greeks | 99.8 /100 | #71 | Exceptional $49,309 |
| Immigrants | Hungary | 99.8 /100 | #72 | Exceptional $49,303 |
| Immigrants | North America | 99.8 /100 | #73 | Exceptional $49,302 |
| Mongolians | 99.8 /100 | #74 | Exceptional $49,173 |
| Immigrants | Bolivia | 99.7 /100 | #75 | Exceptional $48,970 |
| Immigrants | England | 99.7 /100 | #76 | Exceptional $48,844 |
| Immigrants | Kazakhstan | 99.7 /100 | #77 | Exceptional $48,747 |
| Immigrants | Italy | 99.6 /100 | #78 | Exceptional $48,654 |
| Romanians | 99.5 /100 | #79 | Exceptional $48,445 |
| Egyptians | 99.5 /100 | #80 | Exceptional $48,358 |
| Armenians | 99.4 /100 | #81 | Exceptional $48,287 |
| Immigrants | Indonesia | 99.4 /100 | #82 | Exceptional $48,195 |
| Immigrants | Brazil | 99.4 /100 | #83 | Exceptional $48,164 |
| Immigrants | Ukraine | 99.3 /100 | #84 | Exceptional $48,134 |
| Austrians | 99.3 /100 | #85 | Exceptional $48,116 |
| Immigrants | Southern Europe | 99.3 /100 | #86 | Exceptional $48,027 |
| Ukrainians | 99.3 /100 | #87 | Exceptional $48,014 |
| Croatians | 99.0 /100 | #88 | Exceptional $47,742 |
| Northern Europeans | 98.9 /100 | #89 | Exceptional $47,698 |
| Italians | 98.8 /100 | #90 | Exceptional $47,574 |
| Macedonians | 98.8 /100 | #91 | Exceptional $47,573 |