Mongolian vs Immigrants from Turkey Householder Income Over 65 years
COMPARE
Mongolian
Immigrants from Turkey
Householder Income Over 65 years
Householder Income Over 65 years Comparison
Mongolians
Immigrants from Turkey
$65,326
HOUSEHOLDER INCOME OVER 65 YEARS
99.0/ 100
METRIC RATING
70th/ 347
METRIC RANK
$66,672
HOUSEHOLDER INCOME OVER 65 YEARS
99.7/ 100
METRIC RATING
50th/ 347
METRIC RANK
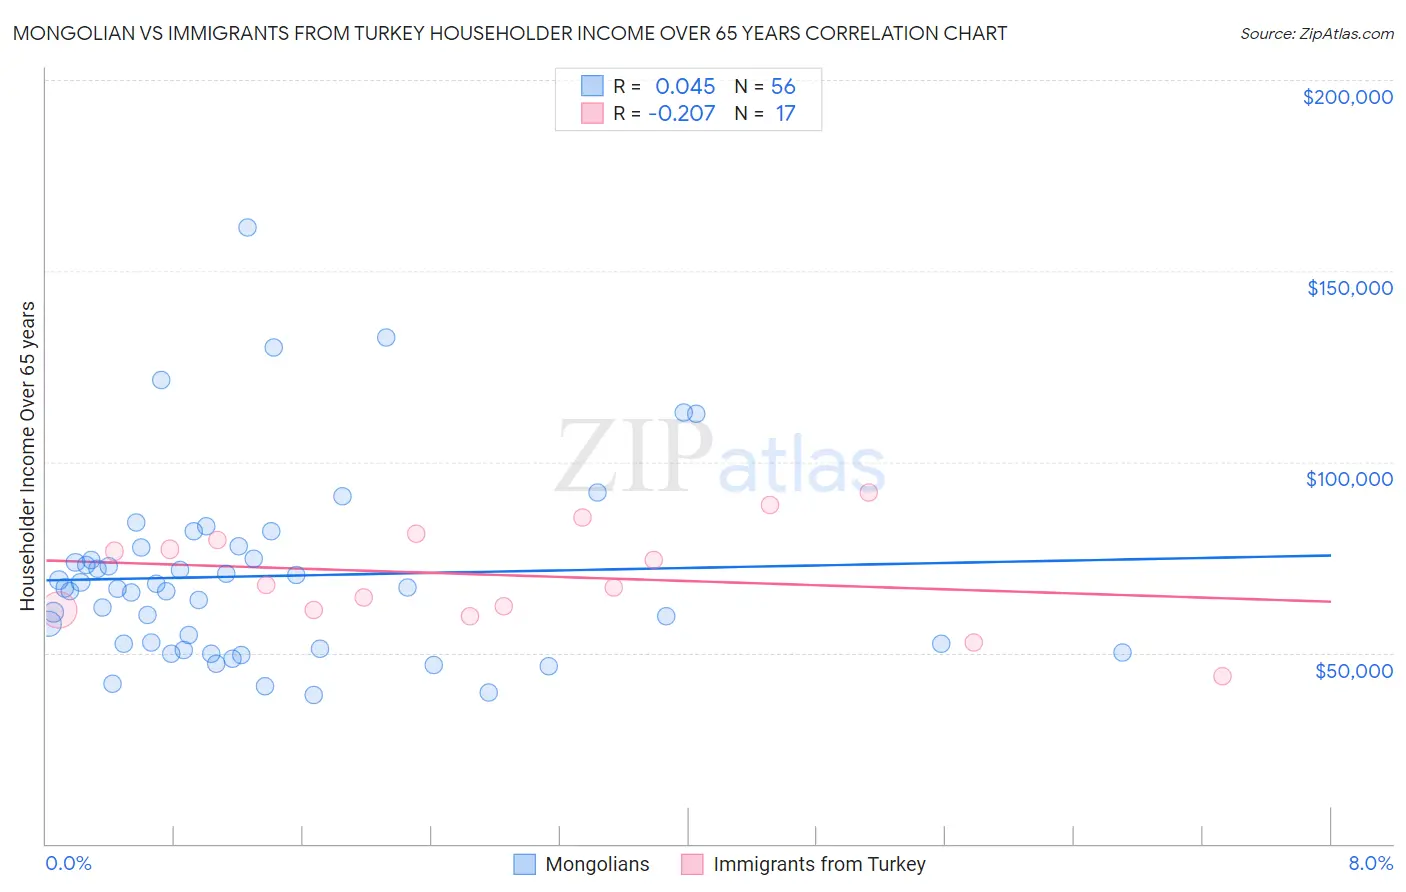
Mongolian vs Immigrants from Turkey Householder Income Over 65 years Correlation Chart
The statistical analysis conducted on geographies consisting of 140,116,166 people shows no correlation between the proportion of Mongolians and household income with householder over the age of 65 in the United States with a correlation coefficient (R) of 0.045 and weighted average of $65,326. Similarly, the statistical analysis conducted on geographies consisting of 222,687,892 people shows a weak negative correlation between the proportion of Immigrants from Turkey and household income with householder over the age of 65 in the United States with a correlation coefficient (R) of -0.207 and weighted average of $66,672, a difference of 2.1%.
Householder Income Over 65 years Correlation Summary
| Measurement | Mongolian | Immigrants from Turkey |
| Minimum | $39,115 | $43,837 |
| Maximum | $161,250 | $92,034 |
| Range | $122,135 | $48,197 |
| Mean | $70,084 | $70,329 |
| Median | $66,894 | $67,840 |
| Interquartile 25% (IQ1) | $51,691 | $61,337 |
| Interquartile 75% (IQ3) | $76,091 | $80,283 |
| Interquartile Range (IQR) | $24,400 | $18,946 |
| Standard Deviation (Sample) | $24,736 | $13,059 |
| Standard Deviation (Population) | $24,514 | $12,670 |
Demographics Similar to Mongolians and Immigrants from Turkey by Householder Income Over 65 years
In terms of householder income over 65 years, the demographic groups most similar to Mongolians are Samoan ($65,427, a difference of 0.15%), Egyptian ($65,441, a difference of 0.18%), Immigrants from Malaysia ($65,497, a difference of 0.26%), South African ($65,652, a difference of 0.50%), and Immigrants from England ($65,715, a difference of 0.60%). Similarly, the demographic groups most similar to Immigrants from Turkey are Israeli ($66,636, a difference of 0.050%), Immigrants from Scotland ($66,620, a difference of 0.080%), Immigrants from Pakistan ($66,617, a difference of 0.080%), Immigrants from Netherlands ($66,463, a difference of 0.31%), and Immigrants from Czechoslovakia ($66,376, a difference of 0.45%).
| Demographics | Rating | Rank | Householder Income Over 65 years |
| Immigrants | Turkey | 99.7 /100 | #50 | Exceptional $66,672 |
| Israelis | 99.7 /100 | #51 | Exceptional $66,636 |
| Immigrants | Scotland | 99.7 /100 | #52 | Exceptional $66,620 |
| Immigrants | Pakistan | 99.7 /100 | #53 | Exceptional $66,617 |
| Immigrants | Netherlands | 99.7 /100 | #54 | Exceptional $66,463 |
| Immigrants | Czechoslovakia | 99.7 /100 | #55 | Exceptional $66,376 |
| Laotians | 99.6 /100 | #56 | Exceptional $66,306 |
| Bulgarians | 99.6 /100 | #57 | Exceptional $66,236 |
| Immigrants | Philippines | 99.6 /100 | #58 | Exceptional $66,161 |
| Immigrants | Norway | 99.5 /100 | #59 | Exceptional $66,118 |
| Immigrants | Lithuania | 99.5 /100 | #60 | Exceptional $66,087 |
| Maltese | 99.5 /100 | #61 | Exceptional $66,027 |
| Immigrants | Sierra Leone | 99.5 /100 | #62 | Exceptional $66,009 |
| Marshallese | 99.4 /100 | #63 | Exceptional $65,874 |
| Zimbabweans | 99.4 /100 | #64 | Exceptional $65,854 |
| Immigrants | England | 99.3 /100 | #65 | Exceptional $65,715 |
| South Africans | 99.3 /100 | #66 | Exceptional $65,652 |
| Immigrants | Malaysia | 99.1 /100 | #67 | Exceptional $65,497 |
| Egyptians | 99.1 /100 | #68 | Exceptional $65,441 |
| Samoans | 99.1 /100 | #69 | Exceptional $65,427 |
| Mongolians | 99.0 /100 | #70 | Exceptional $65,326 |