Mexican vs Immigrants from Italy Householder Income Over 65 years

COMPARE

Mexican
Race
Ancestry
AfghanAfricanAlaska NativeAlaskan AthabascanAlbanianAleutAlsatianAmericanApacheArabArapahoArgentineanArmenianAssyrian/Chaldean/SyriacAustralianAustrianBahamianBangladeshiBarbadianBasqueBelgianBelizeanBermudanBhutaneseBlackfeetBolivianBrazilianBritishBritish West IndianBulgarianBurmeseCajunCambodianCanadianCape VerdeanCarpatho RusynCelticCentral AmericanCentral American IndianCherokeeCheyenneChickasawChileanChineseChippewaChoctawColombianColvilleComancheCosta RicanCreeCreekCroatianCrowCubanCypriotCzechCzechoslovakianDanishDelawareDominicanDutchDutch West IndianEastern EuropeanEcuadorianEgyptianEnglishEstonianEthiopianEuropeanFijianFilipinoFinnishFrenchFrench American IndianFrench CanadianGermanGerman RussianGhanaianGreekGuamanian/ChamorroGuatemalanGuyaneseHaitianHmongHonduranHopiHoumaHungarianIcelanderIndian (Asian)IndonesianInupiatIranianIraqiIrishIroquoisIsraeliItalianJamaicanJapaneseJordanianKenyanKiowaKoreanLaotianLatvianLebaneseLiberianLithuanianLumbeeLuxembourgerMacedonianMalaysianMalteseMarshalleseMenomineeMexicanMexican American IndianMongolianMoroccanNative HawaiianNavajoNepaleseNew ZealanderNicaraguanNigerianNorthern EuropeanNorwegianOkinawanOsageOttawaPaiutePakistaniPalestinianPanamanianParaguayanPennsylvania GermanPeruvianPimaPolishPortuguesePotawatomiPuebloPuerto RicanPuget Sound SalishRomanianRussianSalvadoranSamoanScandinavianScotch-IrishScottishSeminoleSenegaleseSerbianShoshoneSierra LeoneanSiouxSlavicSlovakSloveneSomaliSouth AfricanSouth AmericanSouth American IndianSoviet UnionSpaniardSpanishSpanish AmericanSpanish American IndianSri LankanSubsaharan AfricanSudaneseSwedishSwissSyrianTaiwaneseThaiTlingit-HaidaTohono O'OdhamTonganTrinidadian and TobagonianTsimshianTurkishU.S. Virgin IslanderUgandanUkrainianUruguayanUteVenezuelanVietnameseWelshWest IndianYakamaYaquiYugoslavianYumanYup'ikZimbabwean
Immigration
NonimmigrantsImmigrantsAfghanistanAfricaAlbaniaArgentinaArmeniaAsiaAustraliaAustriaBahamasBangladeshBarbadosBelarusBelgiumBelizeBoliviaBosnia and HerzegovinaBrazilBulgariaBurma/MyanmarCabo VerdeCambodiaCameroonCanadaCaribbeanCentral AmericaChileChinaColombiaCongoCosta RicaCroatiaCubaCzechoslovakiaDenmarkDominicaDominican RepublicEastern AfricaEastern AsiaEastern EuropeEcuadorEgyptEl SalvadorEnglandEritreaEthiopiaEuropeFijiFranceGermanyGhanaGreeceGrenadaGuatemalaGuyanaHaitiHondurasHong KongHungaryIndiaIndonesiaIranIraqIrelandIsraelJamaicaJapanJordanKazakhstanKenyaKoreaKuwaitLaosLatin AmericaLatviaLebanonLiberiaLithuaniaMalaysiaMexicoMicronesiaMiddle AfricaMoldovaMoroccoNepalNetherlandsNicaraguaNigeriaNorth AmericaNorth MacedoniaNorthern AfricaNorthern EuropeNorwayOceaniaPakistanPanamaPeruPhilippinesPolandPortugalRomaniaRussiaSaudi ArabiaScotlandSenegalSerbiaSierra LeoneSingaporeSomaliaSouth AfricaSouth AmericaSouth Central AsiaSouth Eastern AsiaSouthern EuropeSpainSri LankaSt. Vincent and the GrenadinesSudanSwedenSwitzerlandSyriaTaiwanThailandTrinidad and TobagoTurkeyUgandaUkraineUruguayUzbekistanVenezuelaVietnamWest IndiesWestern AfricaWestern AsiaWestern EuropeYemenZaireZimbabweAzores
Immigrants from Italy
Race
Ancestry
AfghanAfricanAlaska NativeAlaskan AthabascanAlbanianAleutAlsatianAmericanApacheArabArapahoArgentineanArmenianAssyrian/Chaldean/SyriacAustralianAustrianBahamianBangladeshiBarbadianBasqueBelgianBelizeanBermudanBhutaneseBlackfeetBolivianBrazilianBritishBritish West IndianBulgarianBurmeseCajunCambodianCanadianCape VerdeanCarpatho RusynCelticCentral AmericanCentral American IndianCherokeeCheyenneChickasawChileanChineseChippewaChoctawColombianColvilleComancheCosta RicanCreeCreekCroatianCrowCubanCypriotCzechCzechoslovakianDanishDelawareDominicanDutchDutch West IndianEastern EuropeanEcuadorianEgyptianEnglishEstonianEthiopianEuropeanFijianFilipinoFinnishFrenchFrench American IndianFrench CanadianGermanGerman RussianGhanaianGreekGuamanian/ChamorroGuatemalanGuyaneseHaitianHmongHonduranHopiHoumaHungarianIcelanderIndian (Asian)IndonesianInupiatIranianIraqiIrishIroquoisIsraeliItalianJamaicanJapaneseJordanianKenyanKiowaKoreanLaotianLatvianLebaneseLiberianLithuanianLumbeeLuxembourgerMacedonianMalaysianMalteseMarshalleseMenomineeMexican American IndianMongolianMoroccanNative HawaiianNavajoNepaleseNew ZealanderNicaraguanNigerianNorthern EuropeanNorwegianOkinawanOsageOttawaPaiutePakistaniPalestinianPanamanianParaguayanPennsylvania GermanPeruvianPimaPolishPortuguesePotawatomiPuebloPuerto RicanPuget Sound SalishRomanianRussianSalvadoranSamoanScandinavianScotch-IrishScottishSeminoleSenegaleseSerbianShoshoneSierra LeoneanSiouxSlavicSlovakSloveneSomaliSouth AfricanSouth AmericanSouth American IndianSoviet UnionSpaniardSpanishSpanish AmericanSpanish American IndianSri LankanSubsaharan AfricanSudaneseSwedishSwissSyrianTaiwaneseThaiTlingit-HaidaTohono O'OdhamTonganTrinidadian and TobagonianTsimshianTurkishU.S. Virgin IslanderUgandanUkrainianUruguayanUteVenezuelanVietnameseWelshWest IndianYakamaYaquiYugoslavianYumanYup'ikZimbabwean
Immigration
NonimmigrantsImmigrantsAfghanistanAfricaAlbaniaArgentinaArmeniaAsiaAustraliaAustriaBahamasBangladeshBarbadosBelarusBelgiumBelizeBoliviaBosnia and HerzegovinaBrazilBulgariaBurma/MyanmarCabo VerdeCambodiaCameroonCanadaCaribbeanCentral AmericaChileChinaColombiaCongoCosta RicaCroatiaCubaCzechoslovakiaDenmarkDominicaDominican RepublicEastern AfricaEastern AsiaEastern EuropeEcuadorEgyptEl SalvadorEnglandEritreaEthiopiaEuropeFijiFranceGermanyGhanaGreeceGrenadaGuatemalaGuyanaHaitiHondurasHong KongHungaryIndiaIndonesiaIranIraqIrelandIsraelItalyJamaicaJapanJordanKazakhstanKenyaKoreaKuwaitLaosLatin AmericaLatviaLebanonLiberiaLithuaniaMalaysiaMexicoMicronesiaMiddle AfricaMoldovaMoroccoNepalNetherlandsNicaraguaNigeriaNorth AmericaNorth MacedoniaNorthern AfricaNorthern EuropeNorwayOceaniaPakistanPanamaPeruPhilippinesPolandPortugalRomaniaRussiaSaudi ArabiaScotlandSenegalSerbiaSierra LeoneSingaporeSomaliaSouth AfricaSouth AmericaSouth Central AsiaSouth Eastern AsiaSouthern EuropeSpainSri LankaSt. Vincent and the GrenadinesSudanSwedenSwitzerlandSyriaTaiwanThailandTrinidad and TobagoTurkeyUgandaUkraineUruguayUzbekistanVenezuelaVietnamWest IndiesWestern AfricaWestern AsiaWestern EuropeYemenZaireZimbabweAzores
Householder Income Over 65 years
Income
Poverty
Unemployment
Labor Participation
Family Structure
Vehicle Availability
Education Level
Disability

Householder Income Over 65 years Comparison

Mexicans

Immigrants from Italy

Tragic
Exceptional
$53,897
HOUSEHOLDER INCOME OVER 65 YEARS
0.1/ 100
METRIC RATING
285th/ 347
METRIC RANK
$64,065
HOUSEHOLDER INCOME OVER 65 YEARS
96.2/ 100
METRIC RATING
101st/ 347
METRIC RANK

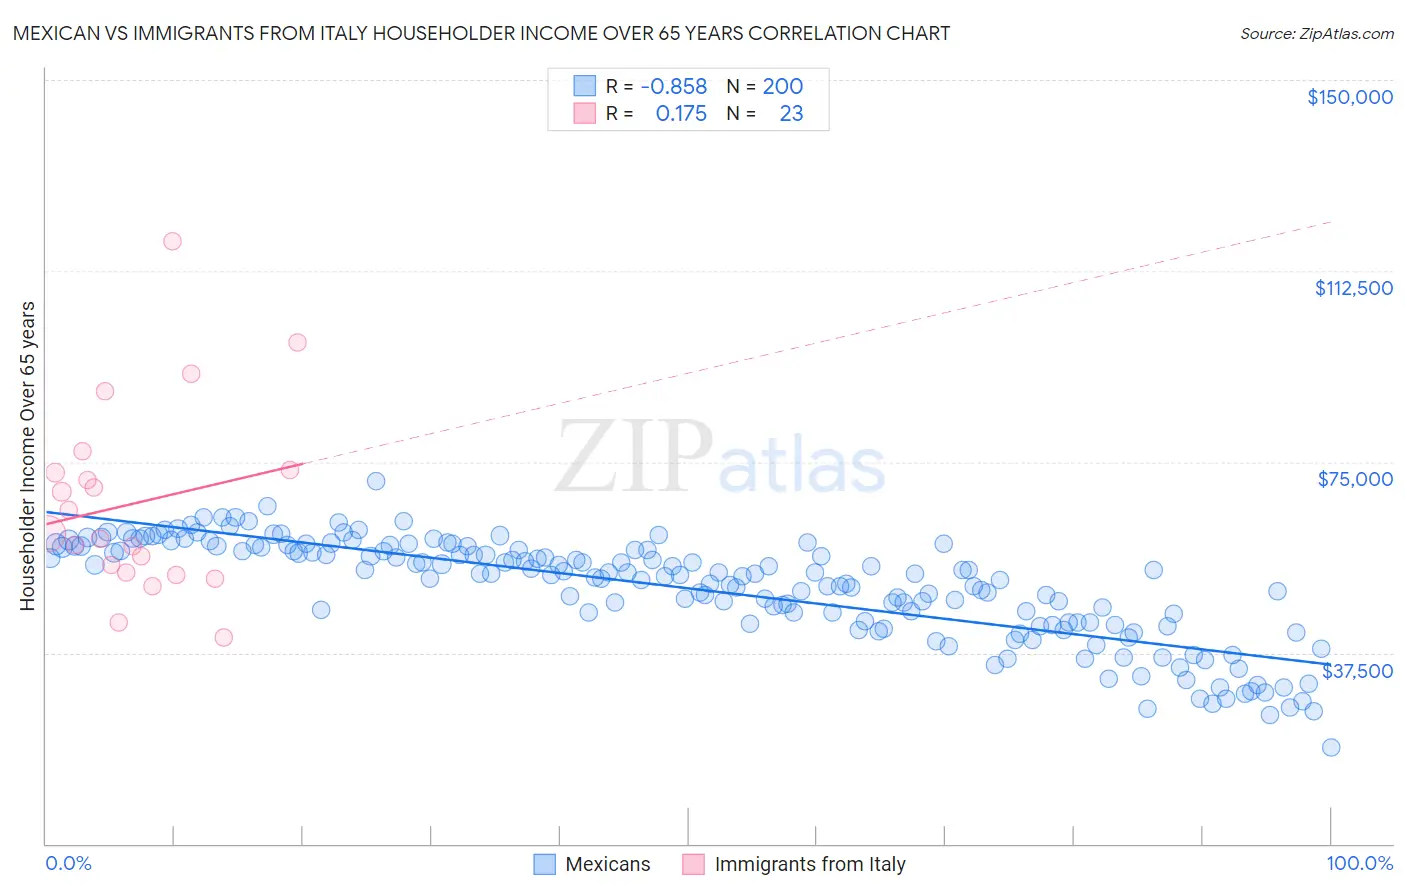
Mexican vs Immigrants from Italy Householder Income Over 65 years Correlation Chart

The statistical analysis conducted on geographies consisting of 559,960,320 people shows a very strong negative correlation between the proportion of Mexicans and household income with householder over the age of 65 in the United States with a correlation coefficient (R) of -0.858 and weighted average of $53,897. Similarly, the statistical analysis conducted on geographies consisting of 323,658,132 people shows a poor positive correlation between the proportion of Immigrants from Italy and household income with householder over the age of 65 in the United States with a correlation coefficient (R) of 0.175 and weighted average of $64,065, a difference of 18.9%.
Mexican vs Immigrants from Italy Householder Income Over 65 years

Householder Income Over 65 years Correlation Summary

MeasurementMexicanImmigrants from Italy
Minimum$18,818$40,625
Maximum$71,178$118,263
Range$52,360$77,638
Mean$50,150$66,915
Median$52,997$60,782
Interquartile 25% (IQ1)$43,543$53,273
Interquartile 75% (IQ3)$58,155$73,333
Interquartile Range (IQR)$14,612$20,060
Standard Deviation (Sample)$10,117$18,554
Standard Deviation (Population)$10,091$18,146

Similar Demographics by Householder Income Over 65 years

Demographics Similar to Mexicans by Householder Income Over 65 years

In terms of householder income over 65 years, the demographic groups most similar to Mexicans are Chippewa ($53,847, a difference of 0.090%), Immigrants from Guatemala ($53,950, a difference of 0.10%), Immigrants from Liberia ($53,967, a difference of 0.13%), Immigrants from Armenia ($53,974, a difference of 0.14%), and Somali ($54,004, a difference of 0.20%).
DemographicsRating | RankHouseholder Income Over 65 years
Immigrants | Ecuador
0.1
/100
|
#278
Tragic
$54,030
Blackfeet
0.1
/100
|
#279
Tragic
$54,029
Immigrants | Jamaica
0.1
/100
|
#280
Tragic
$54,027
Somalis
0.1
/100
|
#281
Tragic
$54,004
Immigrants | Armenia
0.1
/100
|
#282
Tragic
$53,974
Immigrants | Liberia
0.1
/100
|
#283
Tragic
$53,967
Immigrants | Guatemala
0.1
/100
|
#284
Tragic
$53,950
Mexicans
0.1
/100
|
#285
Tragic
$53,897
Chippewa
0.1
/100
|
#286
Tragic
$53,847
Immigrants | Barbados
0.1
/100
|
#287
Tragic
$53,766
Paiute
0.1
/100
|
#288
Tragic
$53,762
Iroquois
0.1
/100
|
#289
Tragic
$53,737
Chickasaw
0.1
/100
|
#290
Tragic
$53,732
Africans
0.0
/100
|
#291
Tragic
$53,711
Shoshone
0.0
/100
|
#292
Tragic
$53,681

Demographics Similar to Immigrants from Italy by Householder Income Over 65 years

In terms of householder income over 65 years, the demographic groups most similar to Immigrants from Italy are Immigrants from South Eastern Asia ($64,089, a difference of 0.040%), Assyrian/Chaldean/Syriac ($64,108, a difference of 0.070%), Romanian ($64,142, a difference of 0.12%), Chilean ($63,957, a difference of 0.17%), and British ($63,940, a difference of 0.20%).
DemographicsRating | RankHouseholder Income Over 65 years
Immigrants | Egypt
97.0
/100
|
#94
Exceptional
$64,299
Immigrants | Latvia
97.0
/100
|
#95
Exceptional
$64,298
Immigrants | Hungary
97.0
/100
|
#96
Exceptional
$64,277
Sri Lankans
96.7
/100
|
#97
Exceptional
$64,201
Romanians
96.5
/100
|
#98
Exceptional
$64,142
Assyrians/Chaldeans/Syriacs
96.4
/100
|
#99
Exceptional
$64,108
Immigrants | South Eastern Asia
96.3
/100
|
#100
Exceptional
$64,089
Immigrants | Italy
96.2
/100
|
#101
Exceptional
$64,065
Chileans
95.8
/100
|
#102
Exceptional
$63,957
British
95.7
/100
|
#103
Exceptional
$63,940
Immigrants | Cameroon
95.6
/100
|
#104
Exceptional
$63,907
Italians
95.5
/100
|
#105
Exceptional
$63,885
Immigrants | Argentina
95.5
/100
|
#106
Exceptional
$63,885
Pakistanis
95.3
/100
|
#107
Exceptional
$63,844
Palestinians
95.1
/100
|
#108
Exceptional
$63,800