Mexican vs Creek Median Family Income
COMPARE
Mexican
Creek
Median Family Income
Median Family Income Comparison
Mexicans
Creek
$85,618
MEDIAN FAMILY INCOME
0.0/ 100
METRIC RATING
304th/ 347
METRIC RANK
$82,560
MEDIAN FAMILY INCOME
0.0/ 100
METRIC RATING
324th/ 347
METRIC RANK
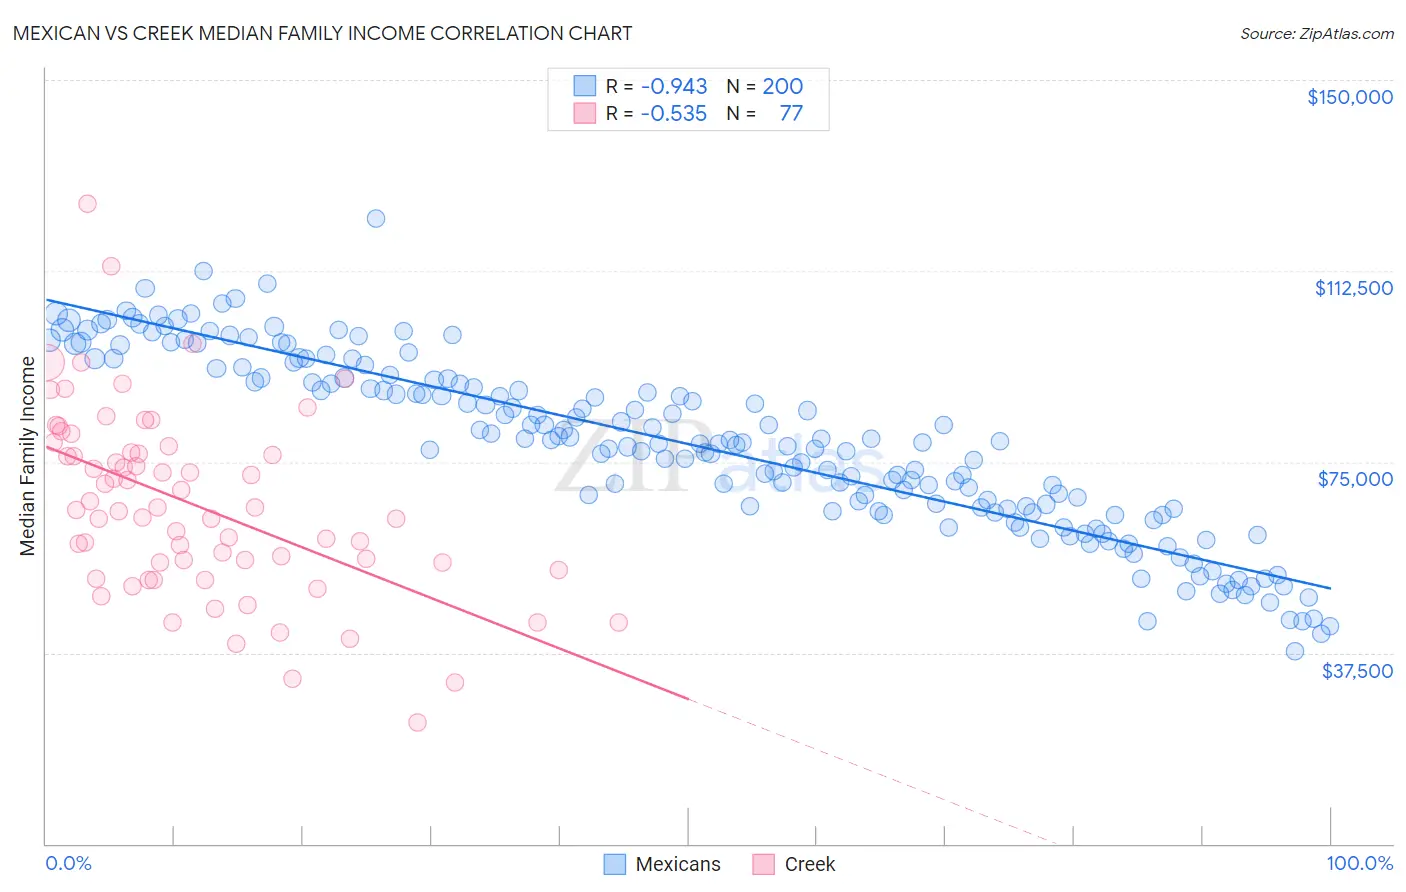
Mexican vs Creek Median Family Income Correlation Chart
The statistical analysis conducted on geographies consisting of 563,853,219 people shows a near-perfect negative correlation between the proportion of Mexicans and median family income in the United States with a correlation coefficient (R) of -0.943 and weighted average of $85,618. Similarly, the statistical analysis conducted on geographies consisting of 178,420,625 people shows a substantial negative correlation between the proportion of Creek and median family income in the United States with a correlation coefficient (R) of -0.535 and weighted average of $82,560, a difference of 3.7%.
Median Family Income Correlation Summary
| Measurement | Mexican | Creek |
| Minimum | $37,850 | $23,750 |
| Maximum | $122,714 | $125,671 |
| Range | $84,864 | $101,921 |
| Mean | $78,476 | $66,532 |
| Median | $78,807 | $65,440 |
| Interquartile 25% (IQ1) | $65,810 | $54,458 |
| Interquartile 75% (IQ3) | $91,475 | $77,450 |
| Interquartile Range (IQR) | $25,665 | $22,992 |
| Standard Deviation (Sample) | $17,414 | $18,322 |
| Standard Deviation (Population) | $17,371 | $18,202 |
Demographics Similar to Mexicans and Creek by Median Family Income
In terms of median family income, the demographic groups most similar to Mexicans are Paiute ($85,414, a difference of 0.24%), Immigrants from Dominica ($85,411, a difference of 0.24%), Chickasaw ($85,356, a difference of 0.31%), U.S. Virgin Islander ($85,294, a difference of 0.38%), and Haitian ($85,218, a difference of 0.47%). Similarly, the demographic groups most similar to Creek are Bahamian ($82,631, a difference of 0.090%), Dominican ($82,888, a difference of 0.40%), Immigrants from Caribbean ($83,319, a difference of 0.92%), Seminole ($83,354, a difference of 0.96%), and Immigrants from Honduras ($83,618, a difference of 1.3%).
| Demographics | Rating | Rank | Median Family Income |
| Mexicans | 0.0 /100 | #304 | Tragic $85,618 |
| Paiute | 0.0 /100 | #305 | Tragic $85,414 |
| Immigrants | Dominica | 0.0 /100 | #306 | Tragic $85,411 |
| Chickasaw | 0.0 /100 | #307 | Tragic $85,356 |
| U.S. Virgin Islanders | 0.0 /100 | #308 | Tragic $85,294 |
| Haitians | 0.0 /100 | #309 | Tragic $85,218 |
| Immigrants | Central America | 0.0 /100 | #310 | Tragic $85,050 |
| Hondurans | 0.0 /100 | #311 | Tragic $85,004 |
| Cubans | 0.0 /100 | #312 | Tragic $84,981 |
| Choctaw | 0.0 /100 | #313 | Tragic $84,835 |
| Immigrants | Bahamas | 0.0 /100 | #314 | Tragic $84,732 |
| Apache | 0.0 /100 | #315 | Tragic $84,451 |
| Immigrants | Haiti | 0.0 /100 | #316 | Tragic $84,018 |
| Yakama | 0.0 /100 | #317 | Tragic $83,932 |
| Immigrants | Mexico | 0.0 /100 | #318 | Tragic $83,639 |
| Immigrants | Honduras | 0.0 /100 | #319 | Tragic $83,618 |
| Seminole | 0.0 /100 | #320 | Tragic $83,354 |
| Immigrants | Caribbean | 0.0 /100 | #321 | Tragic $83,319 |
| Dominicans | 0.0 /100 | #322 | Tragic $82,888 |
| Bahamians | 0.0 /100 | #323 | Tragic $82,631 |
| Creek | 0.0 /100 | #324 | Tragic $82,560 |