Menominee vs Welsh Median Male Earnings
COMPARE
Menominee
Welsh
Median Male Earnings
Median Male Earnings Comparison
Menominee
Welsh
$42,581
MEDIAN MALE EARNINGS
0.0/ 100
METRIC RATING
337th/ 347
METRIC RANK
$54,647
MEDIAN MALE EARNINGS
53.8/ 100
METRIC RATING
172nd/ 347
METRIC RANK
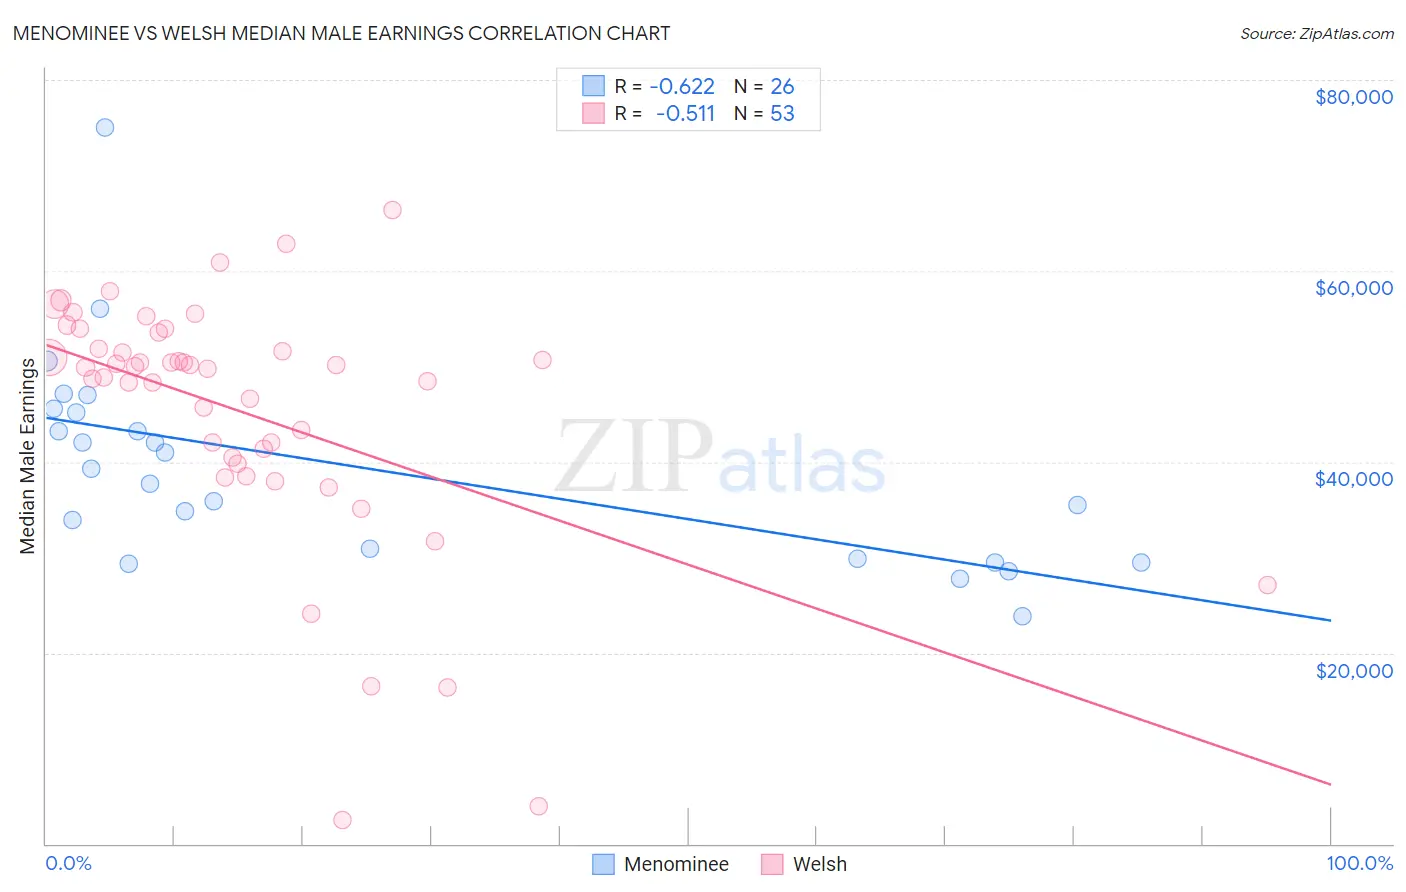
Menominee vs Welsh Median Male Earnings Correlation Chart
The statistical analysis conducted on geographies consisting of 45,775,457 people shows a significant negative correlation between the proportion of Menominee and median male earnings in the United States with a correlation coefficient (R) of -0.622 and weighted average of $42,581. Similarly, the statistical analysis conducted on geographies consisting of 527,949,095 people shows a substantial negative correlation between the proportion of Welsh and median male earnings in the United States with a correlation coefficient (R) of -0.511 and weighted average of $54,647, a difference of 28.3%.
Median Male Earnings Correlation Summary
| Measurement | Menominee | Welsh |
| Minimum | $23,828 | $2,499 |
| Maximum | $75,000 | $66,364 |
| Range | $51,172 | $63,865 |
| Mean | $39,395 | $45,194 |
| Median | $38,495 | $49,839 |
| Interquartile 25% (IQ1) | $29,844 | $40,118 |
| Interquartile 75% (IQ3) | $45,222 | $52,741 |
| Interquartile Range (IQR) | $15,378 | $12,623 |
| Standard Deviation (Sample) | $10,853 | $13,217 |
| Standard Deviation (Population) | $10,643 | $13,092 |
Similar Demographics by Median Male Earnings
Demographics Similar to Menominee by Median Male Earnings
In terms of median male earnings, the demographic groups most similar to Menominee are Crow ($42,434, a difference of 0.35%), Pima ($42,357, a difference of 0.53%), Navajo ($42,098, a difference of 1.1%), Hopi ($42,060, a difference of 1.2%), and Arapaho ($41,758, a difference of 2.0%).
| Demographics | Rating | Rank | Median Male Earnings |
| Immigrants | Mexico | 0.0 /100 | #330 | Tragic $44,960 |
| Natives/Alaskans | 0.0 /100 | #331 | Tragic $44,775 |
| Bahamians | 0.0 /100 | #332 | Tragic $44,756 |
| Immigrants | Congo | 0.0 /100 | #333 | Tragic $44,204 |
| Immigrants | Yemen | 0.0 /100 | #334 | Tragic $44,083 |
| Spanish American Indians | 0.0 /100 | #335 | Tragic $44,010 |
| Immigrants | Cuba | 0.0 /100 | #336 | Tragic $43,461 |
| Menominee | 0.0 /100 | #337 | Tragic $42,581 |
| Crow | 0.0 /100 | #338 | Tragic $42,434 |
| Pima | 0.0 /100 | #339 | Tragic $42,357 |
| Navajo | 0.0 /100 | #340 | Tragic $42,098 |
| Hopi | 0.0 /100 | #341 | Tragic $42,060 |
| Arapaho | 0.0 /100 | #342 | Tragic $41,758 |
| Lumbee | 0.0 /100 | #343 | Tragic $41,715 |
| Pueblo | 0.0 /100 | #344 | Tragic $41,314 |
Demographics Similar to Welsh by Median Male Earnings
In terms of median male earnings, the demographic groups most similar to Welsh are Immigrants from Peru ($54,695, a difference of 0.090%), French Canadian ($54,722, a difference of 0.14%), Finnish ($54,721, a difference of 0.14%), South American Indian ($54,508, a difference of 0.25%), and South American ($54,492, a difference of 0.28%).
| Demographics | Rating | Rank | Median Male Earnings |
| Immigrants | Portugal | 66.3 /100 | #165 | Good $55,182 |
| Germans | 61.6 /100 | #166 | Good $54,974 |
| Immigrants | Fiji | 61.2 /100 | #167 | Good $54,958 |
| Immigrants | Vietnam | 60.2 /100 | #168 | Good $54,913 |
| French Canadians | 55.6 /100 | #169 | Average $54,722 |
| Finns | 55.6 /100 | #170 | Average $54,721 |
| Immigrants | Peru | 54.9 /100 | #171 | Average $54,695 |
| Welsh | 53.8 /100 | #172 | Average $54,647 |
| South American Indians | 50.4 /100 | #173 | Average $54,508 |
| South Americans | 50.0 /100 | #174 | Average $54,492 |
| Dutch | 48.0 /100 | #175 | Average $54,410 |
| Spaniards | 47.8 /100 | #176 | Average $54,401 |
| Costa Ricans | 44.8 /100 | #177 | Average $54,279 |
| Sierra Leoneans | 44.8 /100 | #178 | Average $54,279 |
| Celtics | 43.9 /100 | #179 | Average $54,242 |