Maltese vs German Russian Median Earnings
COMPARE
Maltese
German Russian
Median Earnings
Median Earnings Comparison
Maltese
German Russians
$52,526
MEDIAN EARNINGS
100.0/ 100
METRIC RATING
42nd/ 347
METRIC RANK
$43,200
MEDIAN EARNINGS
1.1/ 100
METRIC RATING
259th/ 347
METRIC RANK
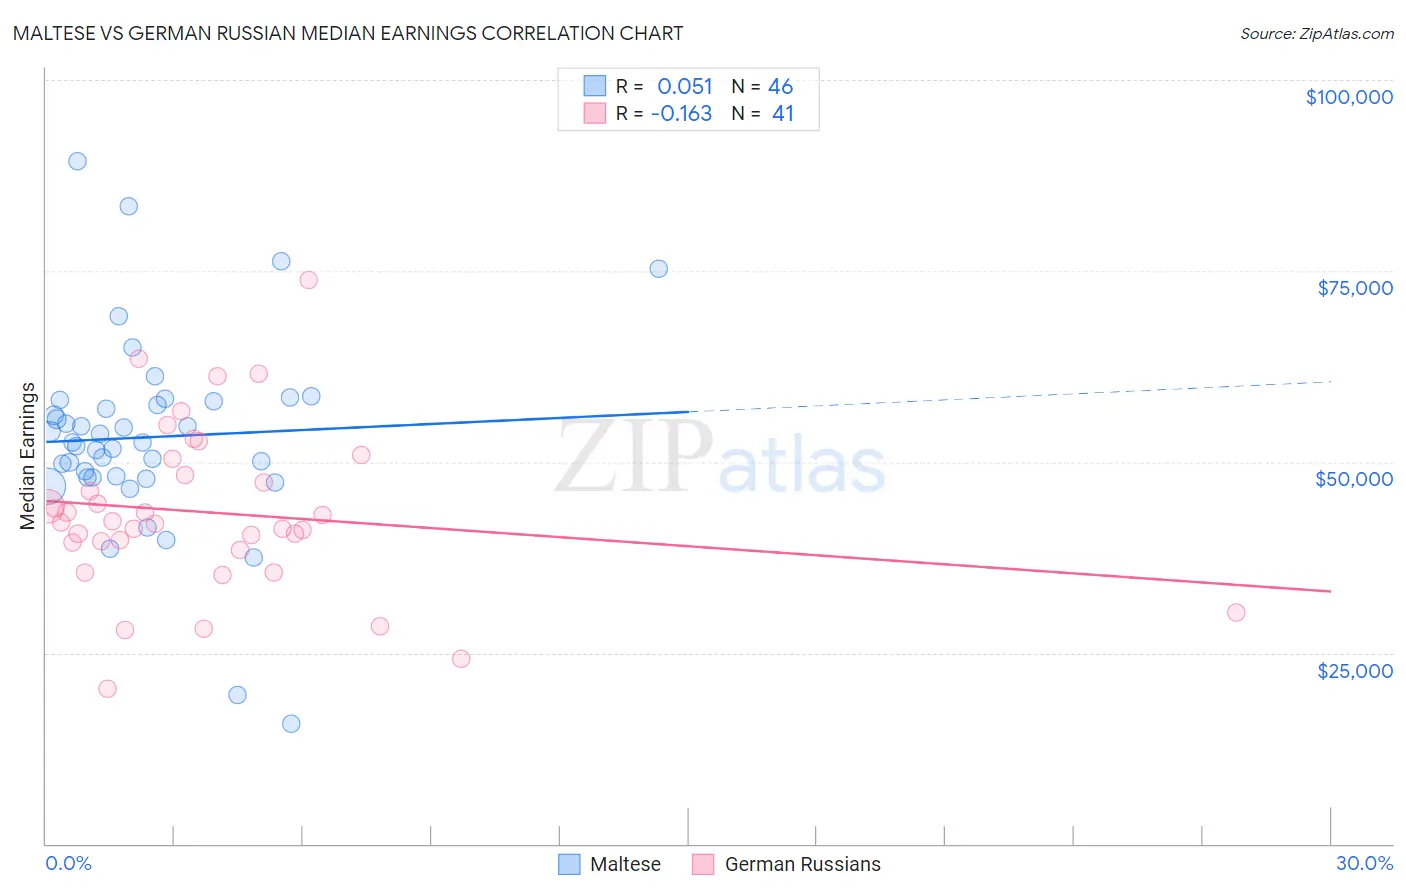
Maltese vs German Russian Median Earnings Correlation Chart
The statistical analysis conducted on geographies consisting of 126,475,400 people shows a slight positive correlation between the proportion of Maltese and median earnings in the United States with a correlation coefficient (R) of 0.051 and weighted average of $52,526. Similarly, the statistical analysis conducted on geographies consisting of 96,461,266 people shows a poor negative correlation between the proportion of German Russians and median earnings in the United States with a correlation coefficient (R) of -0.163 and weighted average of $43,200, a difference of 21.6%.
Median Earnings Correlation Summary
| Measurement | Maltese | German Russian |
| Minimum | $15,781 | $20,324 |
| Maximum | $89,336 | $73,750 |
| Range | $73,555 | $53,426 |
| Mean | $53,240 | $43,344 |
| Median | $52,561 | $42,036 |
| Interquartile 25% (IQ1) | $48,020 | $38,952 |
| Interquartile 75% (IQ3) | $57,908 | $49,348 |
| Interquartile Range (IQR) | $9,888 | $10,396 |
| Standard Deviation (Sample) | $12,910 | $10,822 |
| Standard Deviation (Population) | $12,769 | $10,689 |
Similar Demographics by Median Earnings
Demographics Similar to Maltese by Median Earnings
In terms of median earnings, the demographic groups most similar to Maltese are Immigrants from Malaysia ($52,514, a difference of 0.020%), Bulgarian ($52,512, a difference of 0.030%), Immigrants from Czechoslovakia ($52,361, a difference of 0.31%), Bhutanese ($52,297, a difference of 0.44%), and Australian ($52,294, a difference of 0.44%).
| Demographics | Rating | Rank | Median Earnings |
| Immigrants | Switzerland | 100.0 /100 | #35 | Exceptional $53,211 |
| Immigrants | Denmark | 100.0 /100 | #36 | Exceptional $53,186 |
| Immigrants | Belarus | 100.0 /100 | #37 | Exceptional $53,043 |
| Latvians | 100.0 /100 | #38 | Exceptional $53,001 |
| Immigrants | Turkey | 100.0 /100 | #39 | Exceptional $52,960 |
| Israelis | 100.0 /100 | #40 | Exceptional $52,937 |
| Immigrants | Lithuania | 100.0 /100 | #41 | Exceptional $52,769 |
| Maltese | 100.0 /100 | #42 | Exceptional $52,526 |
| Immigrants | Malaysia | 100.0 /100 | #43 | Exceptional $52,514 |
| Bulgarians | 100.0 /100 | #44 | Exceptional $52,512 |
| Immigrants | Czechoslovakia | 100.0 /100 | #45 | Exceptional $52,361 |
| Bhutanese | 100.0 /100 | #46 | Exceptional $52,297 |
| Australians | 100.0 /100 | #47 | Exceptional $52,294 |
| Immigrants | Europe | 100.0 /100 | #48 | Exceptional $52,195 |
| Bolivians | 100.0 /100 | #49 | Exceptional $52,005 |
Demographics Similar to German Russians by Median Earnings
In terms of median earnings, the demographic groups most similar to German Russians are Immigrants from Somalia ($43,100, a difference of 0.23%), French American Indian ($43,333, a difference of 0.31%), Jamaican ($43,343, a difference of 0.33%), Immigrants from Jamaica ($43,026, a difference of 0.40%), and Nicaraguan ($43,026, a difference of 0.40%).
| Demographics | Rating | Rank | Median Earnings |
| Hawaiians | 2.0 /100 | #252 | Tragic $43,673 |
| Somalis | 1.8 /100 | #253 | Tragic $43,567 |
| Liberians | 1.7 /100 | #254 | Tragic $43,536 |
| Immigrants | Middle Africa | 1.4 /100 | #255 | Tragic $43,416 |
| Alaskan Athabascans | 1.4 /100 | #256 | Tragic $43,393 |
| Jamaicans | 1.3 /100 | #257 | Tragic $43,343 |
| French American Indians | 1.3 /100 | #258 | Tragic $43,333 |
| German Russians | 1.1 /100 | #259 | Tragic $43,200 |
| Immigrants | Somalia | 0.9 /100 | #260 | Tragic $43,100 |
| Immigrants | Jamaica | 0.8 /100 | #261 | Tragic $43,026 |
| Nicaraguans | 0.8 /100 | #262 | Tragic $43,026 |
| Inupiat | 0.8 /100 | #263 | Tragic $43,000 |
| Immigrants | Liberia | 0.7 /100 | #264 | Tragic $42,923 |
| Salvadorans | 0.7 /100 | #265 | Tragic $42,912 |
| Immigrants | Laos | 0.7 /100 | #266 | Tragic $42,884 |