Maltese vs Cheyenne Median Family Income
COMPARE
Maltese
Cheyenne
Median Family Income
Median Family Income Comparison
Maltese
Cheyenne
$115,862
MEDIAN FAMILY INCOME
99.9/ 100
METRIC RATING
52nd/ 347
METRIC RANK
$81,385
MEDIAN FAMILY INCOME
0.0/ 100
METRIC RATING
330th/ 347
METRIC RANK
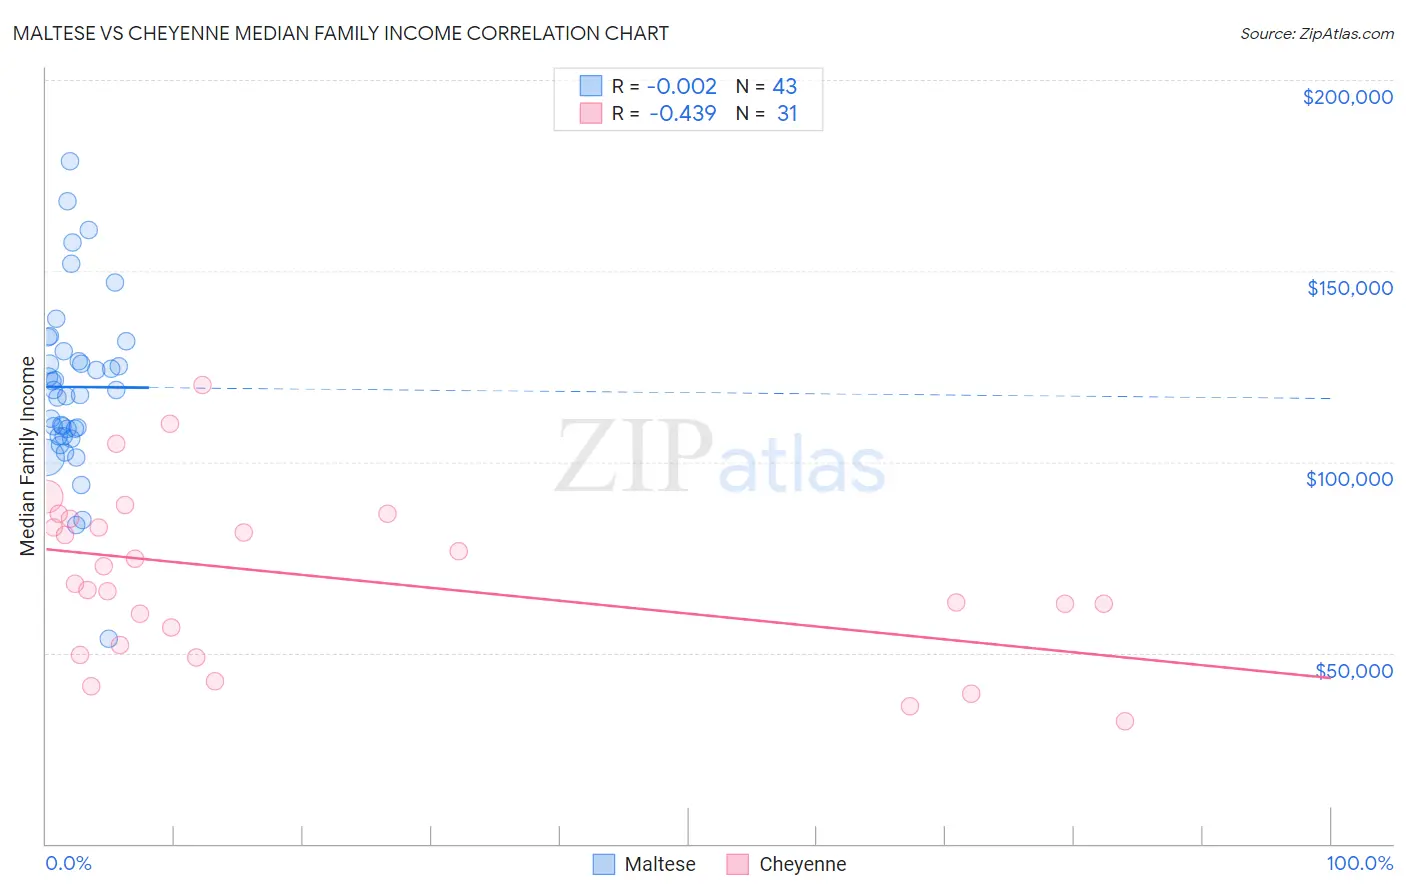
Maltese vs Cheyenne Median Family Income Correlation Chart
The statistical analysis conducted on geographies consisting of 126,250,272 people shows no correlation between the proportion of Maltese and median family income in the United States with a correlation coefficient (R) of -0.002 and weighted average of $115,862. Similarly, the statistical analysis conducted on geographies consisting of 80,698,521 people shows a moderate negative correlation between the proportion of Cheyenne and median family income in the United States with a correlation coefficient (R) of -0.439 and weighted average of $81,385, a difference of 42.4%.
Median Family Income Correlation Summary
| Measurement | Maltese | Cheyenne |
| Minimum | $53,672 | $32,159 |
| Maximum | $178,781 | $120,128 |
| Range | $125,109 | $87,969 |
| Mean | $119,621 | $70,077 |
| Median | $118,717 | $67,927 |
| Interquartile 25% (IQ1) | $106,808 | $52,031 |
| Interquartile 75% (IQ3) | $128,909 | $85,161 |
| Interquartile Range (IQR) | $22,102 | $33,130 |
| Standard Deviation (Sample) | $22,839 | $21,843 |
| Standard Deviation (Population) | $22,571 | $21,488 |
Similar Demographics by Median Family Income
Demographics Similar to Maltese by Median Family Income
In terms of median family income, the demographic groups most similar to Maltese are Immigrants from Malaysia ($115,880, a difference of 0.010%), Immigrants from Norway ($115,847, a difference of 0.010%), Immigrants from Czechoslovakia ($116,165, a difference of 0.26%), Chinese ($116,188, a difference of 0.28%), and Immigrants from Europe ($115,523, a difference of 0.29%).
| Demographics | Rating | Rank | Median Family Income |
| Immigrants | Greece | 99.9 /100 | #45 | Exceptional $117,344 |
| Immigrants | Russia | 99.9 /100 | #46 | Exceptional $116,942 |
| Immigrants | Austria | 99.9 /100 | #47 | Exceptional $116,830 |
| Immigrants | South Africa | 99.9 /100 | #48 | Exceptional $116,286 |
| Chinese | 99.9 /100 | #49 | Exceptional $116,188 |
| Immigrants | Czechoslovakia | 99.9 /100 | #50 | Exceptional $116,165 |
| Immigrants | Malaysia | 99.9 /100 | #51 | Exceptional $115,880 |
| Maltese | 99.9 /100 | #52 | Exceptional $115,862 |
| Immigrants | Norway | 99.9 /100 | #53 | Exceptional $115,847 |
| Immigrants | Europe | 99.9 /100 | #54 | Exceptional $115,523 |
| Lithuanians | 99.8 /100 | #55 | Exceptional $115,395 |
| New Zealanders | 99.8 /100 | #56 | Exceptional $115,230 |
| Greeks | 99.8 /100 | #57 | Exceptional $115,192 |
| Immigrants | Indonesia | 99.8 /100 | #58 | Exceptional $115,162 |
| Immigrants | Netherlands | 99.8 /100 | #59 | Exceptional $114,987 |
Demographics Similar to Cheyenne by Median Family Income
In terms of median family income, the demographic groups most similar to Cheyenne are Immigrants from Dominican Republic ($81,233, a difference of 0.19%), Dutch West Indian ($81,852, a difference of 0.57%), Native/Alaskan ($80,908, a difference of 0.59%), Kiowa ($80,885, a difference of 0.62%), and Black/African American ($81,912, a difference of 0.65%).
| Demographics | Rating | Rank | Median Family Income |
| Bahamians | 0.0 /100 | #323 | Tragic $82,631 |
| Creek | 0.0 /100 | #324 | Tragic $82,560 |
| Sioux | 0.0 /100 | #325 | Tragic $82,386 |
| Immigrants | Congo | 0.0 /100 | #326 | Tragic $82,216 |
| Arapaho | 0.0 /100 | #327 | Tragic $82,064 |
| Blacks/African Americans | 0.0 /100 | #328 | Tragic $81,912 |
| Dutch West Indians | 0.0 /100 | #329 | Tragic $81,852 |
| Cheyenne | 0.0 /100 | #330 | Tragic $81,385 |
| Immigrants | Dominican Republic | 0.0 /100 | #331 | Tragic $81,233 |
| Natives/Alaskans | 0.0 /100 | #332 | Tragic $80,908 |
| Kiowa | 0.0 /100 | #333 | Tragic $80,885 |
| Menominee | 0.0 /100 | #334 | Tragic $79,563 |
| Yup'ik | 0.0 /100 | #335 | Tragic $79,290 |
| Immigrants | Cuba | 0.0 /100 | #336 | Tragic $78,249 |
| Yuman | 0.0 /100 | #337 | Tragic $78,055 |