Macedonian vs Puget Sound Salish Householder Income Ages 45 - 64 years
COMPARE
Macedonian
Puget Sound Salish
Householder Income Ages 45 - 64 years
Householder Income Ages 45 - 64 years Comparison
Macedonians
Puget Sound Salish
$107,074
HOUSEHOLDER INCOME AGES 45 - 64 YEARS
96.7/ 100
METRIC RATING
105th/ 347
METRIC RANK
$98,340
HOUSEHOLDER INCOME AGES 45 - 64 YEARS
27.0/ 100
METRIC RATING
197th/ 347
METRIC RANK
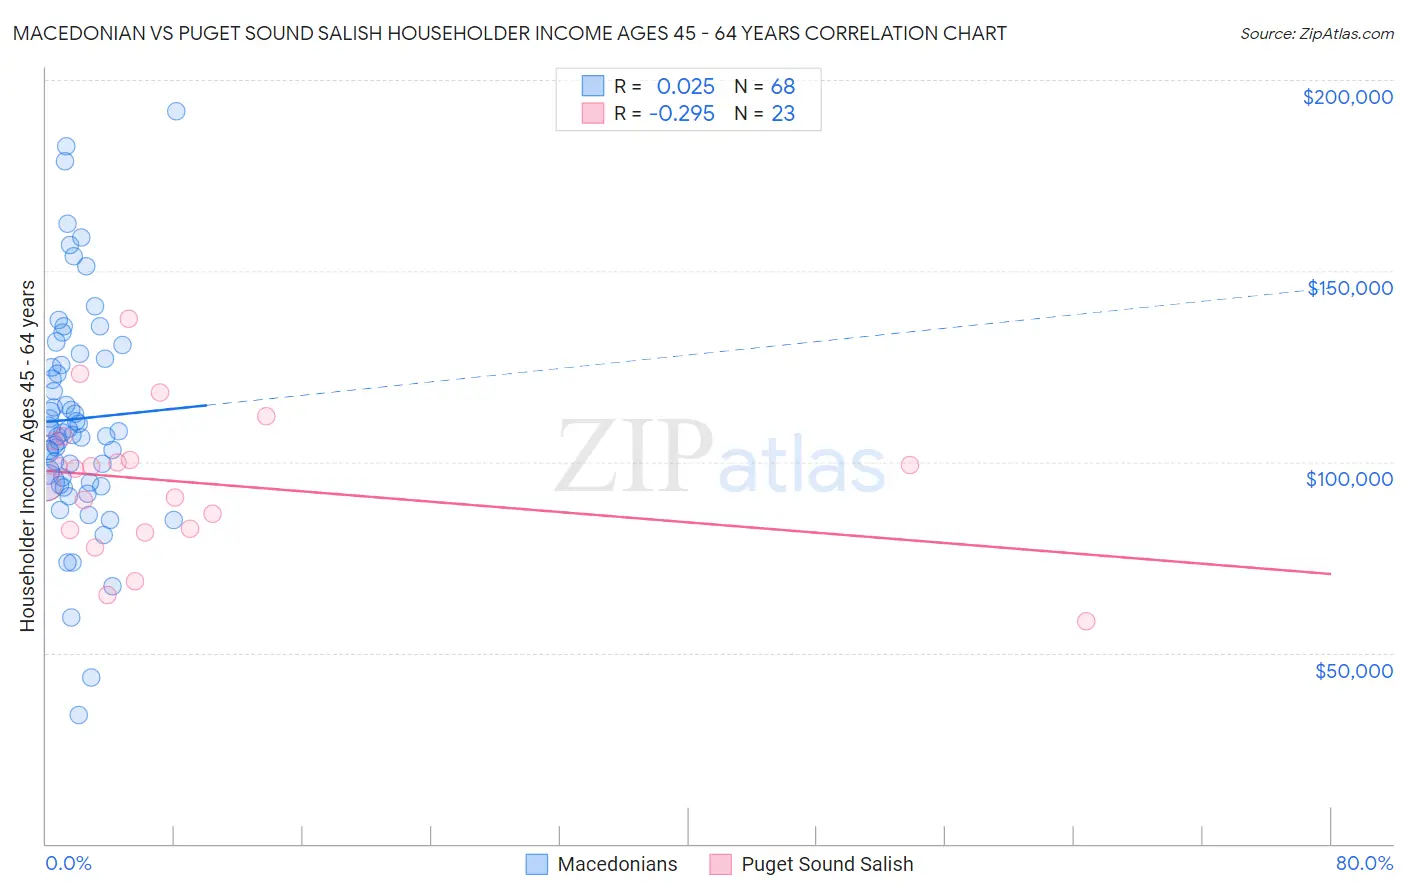
Macedonian vs Puget Sound Salish Householder Income Ages 45 - 64 years Correlation Chart
The statistical analysis conducted on geographies consisting of 132,534,739 people shows no correlation between the proportion of Macedonians and household income with householder between the ages 45 and 64 in the United States with a correlation coefficient (R) of 0.025 and weighted average of $107,074. Similarly, the statistical analysis conducted on geographies consisting of 46,126,240 people shows a weak negative correlation between the proportion of Puget Sound Salish and household income with householder between the ages 45 and 64 in the United States with a correlation coefficient (R) of -0.295 and weighted average of $98,340, a difference of 8.9%.
Householder Income Ages 45 - 64 years Correlation Summary
| Measurement | Macedonian | Puget Sound Salish |
| Minimum | $33,654 | $58,333 |
| Maximum | $191,897 | $137,604 |
| Range | $158,243 | $79,271 |
| Mean | $111,238 | $94,554 |
| Median | $107,950 | $98,357 |
| Interquartile 25% (IQ1) | $94,511 | $82,172 |
| Interquartile 75% (IQ3) | $126,299 | $105,339 |
| Interquartile Range (IQR) | $31,788 | $23,167 |
| Standard Deviation (Sample) | $29,150 | $18,602 |
| Standard Deviation (Population) | $28,934 | $18,193 |
Similar Demographics by Householder Income Ages 45 - 64 years
Demographics Similar to Macedonians by Householder Income Ages 45 - 64 years
In terms of householder income ages 45 - 64 years, the demographic groups most similar to Macedonians are Immigrants from Ukraine ($107,079, a difference of 0.0%), Armenian ($107,002, a difference of 0.070%), Immigrants from Fiji ($106,952, a difference of 0.11%), Syrian ($107,207, a difference of 0.12%), and Zimbabwean ($106,849, a difference of 0.21%).
| Demographics | Rating | Rank | Householder Income Ages 45 - 64 years |
| Immigrants | Southern Europe | 97.7 /100 | #98 | Exceptional $107,775 |
| Palestinians | 97.6 /100 | #99 | Exceptional $107,721 |
| Immigrants | Serbia | 97.4 /100 | #100 | Exceptional $107,569 |
| Immigrants | Kazakhstan | 97.2 /100 | #101 | Exceptional $107,378 |
| Immigrants | Moldova | 97.1 /100 | #102 | Exceptional $107,357 |
| Syrians | 96.9 /100 | #103 | Exceptional $107,207 |
| Immigrants | Ukraine | 96.7 /100 | #104 | Exceptional $107,079 |
| Macedonians | 96.7 /100 | #105 | Exceptional $107,074 |
| Armenians | 96.6 /100 | #106 | Exceptional $107,002 |
| Immigrants | Fiji | 96.5 /100 | #107 | Exceptional $106,952 |
| Zimbabweans | 96.3 /100 | #108 | Exceptional $106,849 |
| Chileans | 95.9 /100 | #109 | Exceptional $106,611 |
| Immigrants | Brazil | 95.6 /100 | #110 | Exceptional $106,470 |
| Immigrants | Vietnam | 95.5 /100 | #111 | Exceptional $106,417 |
| Swedes | 95.4 /100 | #112 | Exceptional $106,377 |
Demographics Similar to Puget Sound Salish by Householder Income Ages 45 - 64 years
In terms of householder income ages 45 - 64 years, the demographic groups most similar to Puget Sound Salish are Immigrants from Eastern Africa ($98,467, a difference of 0.13%), Immigrants from Iraq ($98,201, a difference of 0.14%), Spanish ($98,554, a difference of 0.22%), White/Caucasian ($98,091, a difference of 0.25%), and Uruguayan ($98,660, a difference of 0.32%).
| Demographics | Rating | Rank | Householder Income Ages 45 - 64 years |
| French Canadians | 35.1 /100 | #190 | Fair $99,093 |
| Kenyans | 33.7 /100 | #191 | Fair $98,970 |
| Celtics | 32.9 /100 | #192 | Fair $98,896 |
| Hawaiians | 31.6 /100 | #193 | Fair $98,778 |
| Uruguayans | 30.3 /100 | #194 | Fair $98,660 |
| Spanish | 29.2 /100 | #195 | Fair $98,554 |
| Immigrants | Eastern Africa | 28.3 /100 | #196 | Fair $98,467 |
| Puget Sound Salish | 27.0 /100 | #197 | Fair $98,340 |
| Immigrants | Iraq | 25.7 /100 | #198 | Fair $98,201 |
| Whites/Caucasians | 24.6 /100 | #199 | Fair $98,091 |
| Immigrants | Kenya | 23.5 /100 | #200 | Fair $97,964 |
| Yugoslavians | 20.0 /100 | #201 | Fair $97,558 |
| Tlingit-Haida | 18.9 /100 | #202 | Poor $97,417 |
| Immigrants | Thailand | 18.8 /100 | #203 | Poor $97,400 |
| Immigrants | Eritrea | 18.6 /100 | #204 | Poor $97,373 |