Macedonian vs Immigrants from Southern Europe Median Earnings
COMPARE
Macedonian
Immigrants from Southern Europe
Median Earnings
Median Earnings Comparison
Macedonians
Immigrants from Southern Europe
$49,893
MEDIAN EARNINGS
99.2/ 100
METRIC RATING
91st/ 347
METRIC RANK
$50,280
MEDIAN EARNINGS
99.6/ 100
METRIC RATING
81st/ 347
METRIC RANK
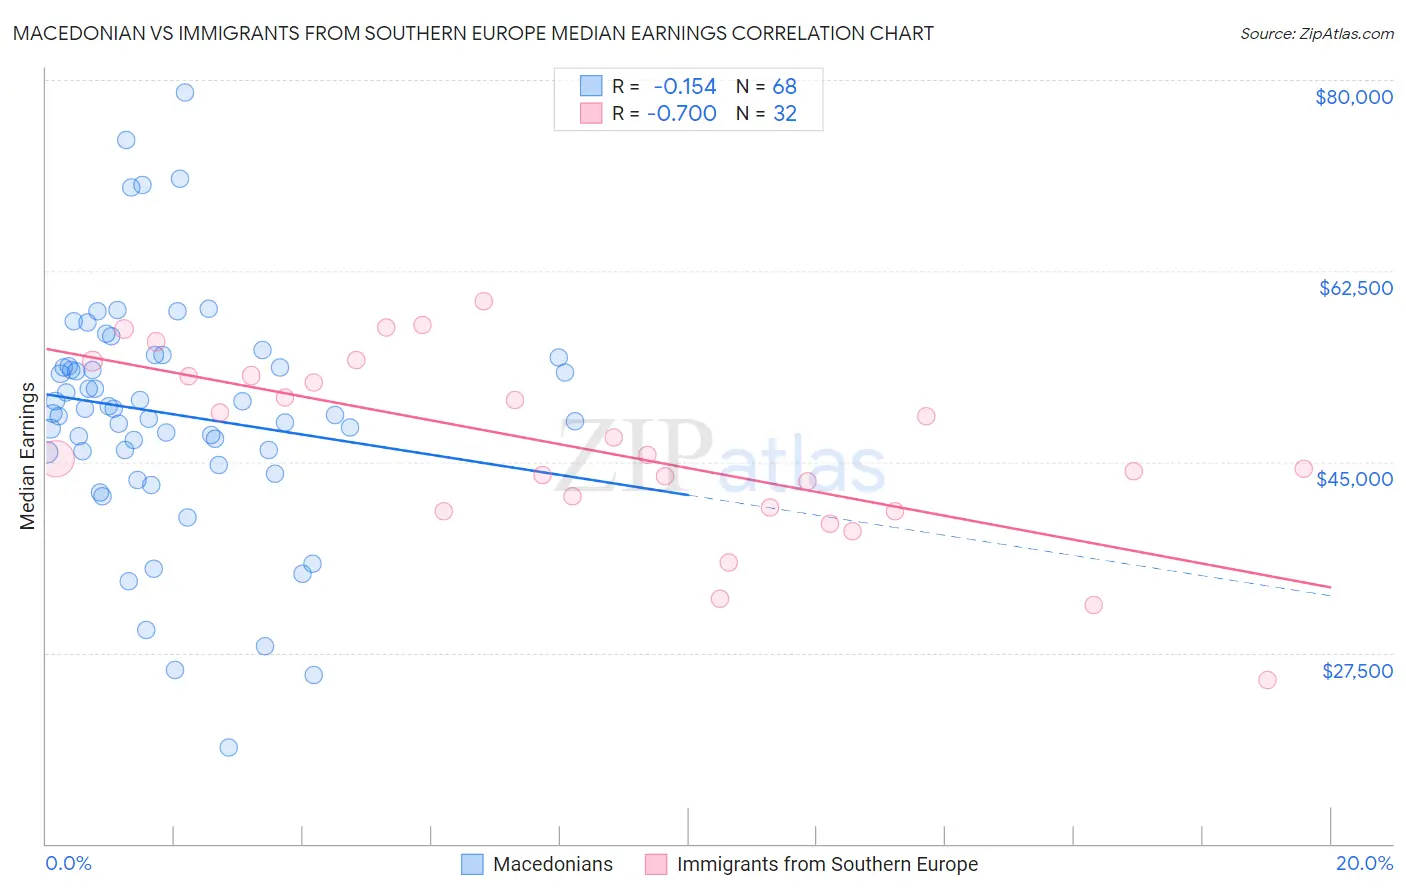
Macedonian vs Immigrants from Southern Europe Median Earnings Correlation Chart
The statistical analysis conducted on geographies consisting of 132,586,624 people shows a poor negative correlation between the proportion of Macedonians and median earnings in the United States with a correlation coefficient (R) of -0.154 and weighted average of $49,893. Similarly, the statistical analysis conducted on geographies consisting of 402,763,457 people shows a significant negative correlation between the proportion of Immigrants from Southern Europe and median earnings in the United States with a correlation coefficient (R) of -0.700 and weighted average of $50,280, a difference of 0.78%.
Median Earnings Correlation Summary
| Measurement | Macedonian | Immigrants from Southern Europe |
| Minimum | $18,816 | $25,046 |
| Maximum | $78,907 | $59,687 |
| Range | $60,091 | $34,641 |
| Mean | $49,392 | $46,213 |
| Median | $49,655 | $45,445 |
| Interquartile 25% (IQ1) | $45,965 | $40,648 |
| Interquartile 75% (IQ3) | $54,145 | $52,864 |
| Interquartile Range (IQR) | $8,180 | $12,216 |
| Standard Deviation (Sample) | $10,833 | $8,358 |
| Standard Deviation (Population) | $10,753 | $8,227 |
Demographics Similar to Macedonians and Immigrants from Southern Europe by Median Earnings
In terms of median earnings, the demographic groups most similar to Macedonians are Italian ($49,915, a difference of 0.040%), Immigrants from Argentina ($49,841, a difference of 0.11%), Armenian ($49,804, a difference of 0.18%), Croatian ($49,724, a difference of 0.34%), and Immigrants from England ($49,722, a difference of 0.34%). Similarly, the demographic groups most similar to Immigrants from Southern Europe are Immigrants from Moldova ($50,274, a difference of 0.010%), Romanian ($50,244, a difference of 0.070%), Ukrainian ($50,320, a difference of 0.080%), Immigrants from Hungary ($50,227, a difference of 0.11%), and Immigrants from Kazakhstan ($50,225, a difference of 0.11%).
| Demographics | Rating | Rank | Median Earnings |
| Immigrants | Italy | 99.7 /100 | #76 | Exceptional $50,581 |
| Immigrants | Western Europe | 99.7 /100 | #77 | Exceptional $50,549 |
| Argentineans | 99.6 /100 | #78 | Exceptional $50,399 |
| Laotians | 99.6 /100 | #79 | Exceptional $50,343 |
| Ukrainians | 99.6 /100 | #80 | Exceptional $50,320 |
| Immigrants | Southern Europe | 99.6 /100 | #81 | Exceptional $50,280 |
| Immigrants | Moldova | 99.5 /100 | #82 | Exceptional $50,274 |
| Romanians | 99.5 /100 | #83 | Exceptional $50,244 |
| Immigrants | Hungary | 99.5 /100 | #84 | Exceptional $50,227 |
| Immigrants | Kazakhstan | 99.5 /100 | #85 | Exceptional $50,225 |
| Immigrants | Canada | 99.5 /100 | #86 | Exceptional $50,192 |
| Immigrants | Uzbekistan | 99.5 /100 | #87 | Exceptional $50,151 |
| Albanians | 99.4 /100 | #88 | Exceptional $50,116 |
| Immigrants | North America | 99.4 /100 | #89 | Exceptional $50,108 |
| Italians | 99.3 /100 | #90 | Exceptional $49,915 |
| Macedonians | 99.2 /100 | #91 | Exceptional $49,893 |
| Immigrants | Argentina | 99.2 /100 | #92 | Exceptional $49,841 |
| Armenians | 99.1 /100 | #93 | Exceptional $49,804 |
| Croatians | 99.0 /100 | #94 | Exceptional $49,724 |
| Immigrants | England | 99.0 /100 | #95 | Exceptional $49,722 |
| Immigrants | Lebanon | 99.0 /100 | #96 | Exceptional $49,682 |