Luxembourger vs Romanian Median Male Earnings
COMPARE
Luxembourger
Romanian
Median Male Earnings
Median Male Earnings Comparison
Luxembourgers
Romanians
$56,300
MEDIAN MALE EARNINGS
85.5/ 100
METRIC RATING
140th/ 347
METRIC RANK
$60,063
MEDIAN MALE EARNINGS
99.6/ 100
METRIC RATING
76th/ 347
METRIC RANK
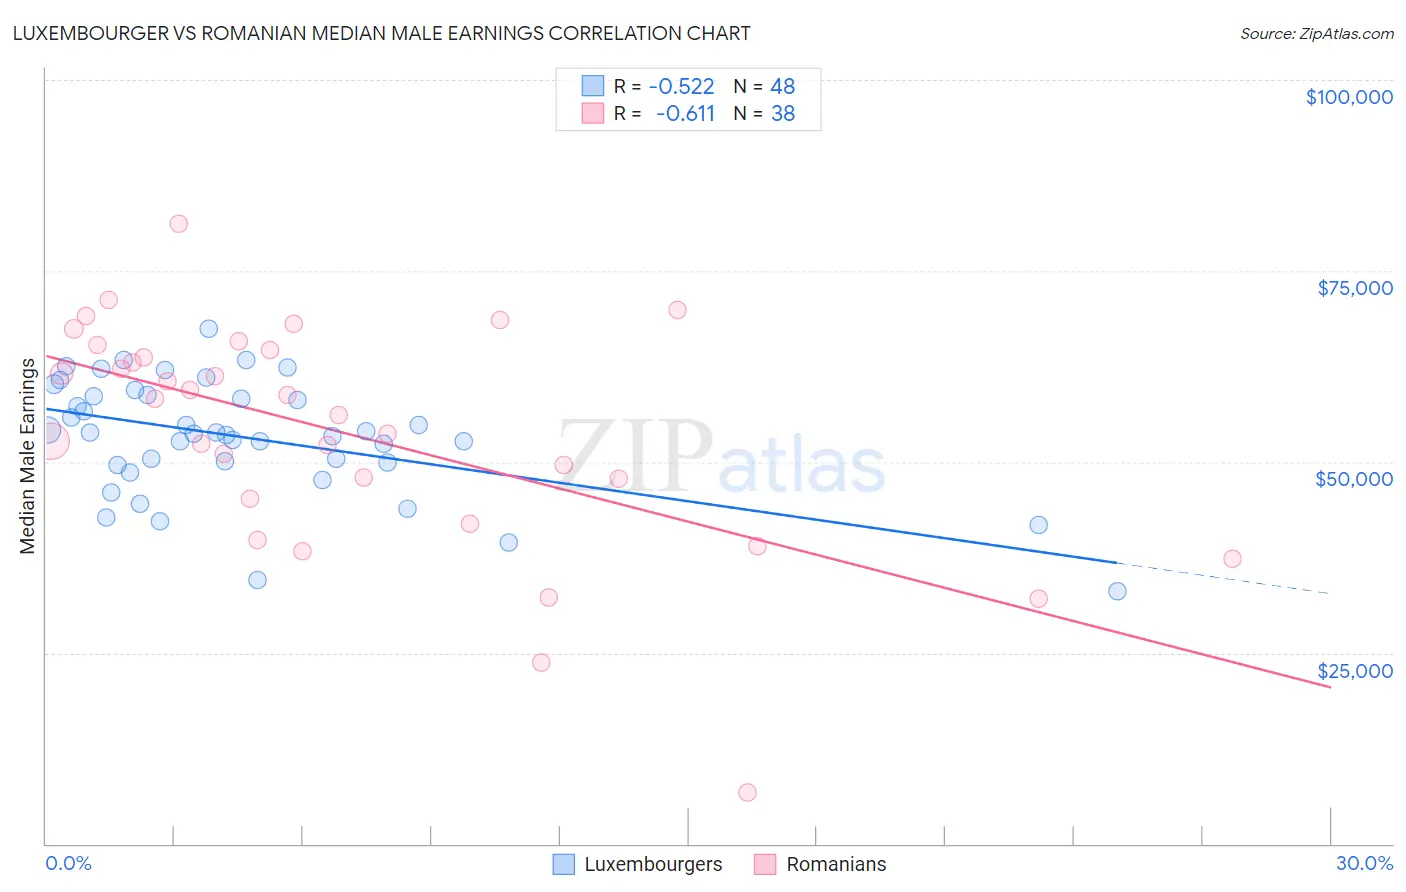
Luxembourger vs Romanian Median Male Earnings Correlation Chart
The statistical analysis conducted on geographies consisting of 144,673,100 people shows a substantial negative correlation between the proportion of Luxembourgers and median male earnings in the United States with a correlation coefficient (R) of -0.522 and weighted average of $56,300. Similarly, the statistical analysis conducted on geographies consisting of 377,805,375 people shows a significant negative correlation between the proportion of Romanians and median male earnings in the United States with a correlation coefficient (R) of -0.611 and weighted average of $60,063, a difference of 6.7%.
Median Male Earnings Correlation Summary
| Measurement | Luxembourger | Romanian |
| Minimum | $33,125 | $6,645 |
| Maximum | $67,500 | $81,155 |
| Range | $34,375 | $74,510 |
| Mean | $53,182 | $53,672 |
| Median | $53,767 | $57,202 |
| Interquartile 25% (IQ1) | $49,758 | $45,217 |
| Interquartile 75% (IQ3) | $58,691 | $64,624 |
| Interquartile Range (IQR) | $8,933 | $19,407 |
| Standard Deviation (Sample) | $7,604 | $15,023 |
| Standard Deviation (Population) | $7,525 | $14,824 |
Similar Demographics by Median Male Earnings
Demographics Similar to Luxembourgers by Median Male Earnings
In terms of median male earnings, the demographic groups most similar to Luxembourgers are Zimbabwean ($56,302, a difference of 0.0%), Slovak ($56,306, a difference of 0.010%), Danish ($56,246, a difference of 0.10%), Ethiopian ($56,243, a difference of 0.10%), and Slavic ($56,390, a difference of 0.16%).
| Demographics | Rating | Rank | Median Male Earnings |
| Immigrants | Germany | 88.2 /100 | #133 | Excellent $56,542 |
| Moroccans | 87.7 /100 | #134 | Excellent $56,499 |
| Irish | 87.4 /100 | #135 | Excellent $56,464 |
| Immigrants | Saudi Arabia | 87.2 /100 | #136 | Excellent $56,452 |
| Slavs | 86.5 /100 | #137 | Excellent $56,390 |
| Slovaks | 85.5 /100 | #138 | Excellent $56,306 |
| Zimbabweans | 85.5 /100 | #139 | Excellent $56,302 |
| Luxembourgers | 85.5 /100 | #140 | Excellent $56,300 |
| Danes | 84.8 /100 | #141 | Excellent $56,246 |
| Ethiopians | 84.8 /100 | #142 | Excellent $56,243 |
| Sri Lankans | 83.4 /100 | #143 | Excellent $56,136 |
| Immigrants | Uganda | 82.4 /100 | #144 | Excellent $56,064 |
| Norwegians | 80.9 /100 | #145 | Excellent $55,965 |
| Immigrants | Chile | 80.7 /100 | #146 | Excellent $55,954 |
| Immigrants | Philippines | 78.4 /100 | #147 | Good $55,809 |
Demographics Similar to Romanians by Median Male Earnings
In terms of median male earnings, the demographic groups most similar to Romanians are Immigrants from Bolivia ($60,088, a difference of 0.040%), Argentinean ($60,117, a difference of 0.090%), Paraguayan ($59,975, a difference of 0.15%), Immigrants from Egypt ($59,925, a difference of 0.23%), and Immigrants from North America ($60,265, a difference of 0.34%).
| Demographics | Rating | Rank | Median Male Earnings |
| Immigrants | Canada | 99.7 /100 | #69 | Exceptional $60,388 |
| Immigrants | Bulgaria | 99.7 /100 | #70 | Exceptional $60,358 |
| Mongolians | 99.7 /100 | #71 | Exceptional $60,350 |
| Immigrants | Western Europe | 99.7 /100 | #72 | Exceptional $60,334 |
| Immigrants | North America | 99.7 /100 | #73 | Exceptional $60,265 |
| Argentineans | 99.6 /100 | #74 | Exceptional $60,117 |
| Immigrants | Bolivia | 99.6 /100 | #75 | Exceptional $60,088 |
| Romanians | 99.6 /100 | #76 | Exceptional $60,063 |
| Paraguayans | 99.5 /100 | #77 | Exceptional $59,975 |
| Immigrants | Egypt | 99.5 /100 | #78 | Exceptional $59,925 |
| Immigrants | Ukraine | 99.5 /100 | #79 | Exceptional $59,820 |
| Immigrants | Hungary | 99.5 /100 | #80 | Exceptional $59,806 |
| Ukrainians | 99.4 /100 | #81 | Exceptional $59,728 |
| Croatians | 99.4 /100 | #82 | Exceptional $59,715 |
| Immigrants | Italy | 99.4 /100 | #83 | Exceptional $59,691 |