Luxembourger vs Immigrants from Senegal Per Capita Income
COMPARE
Luxembourger
Immigrants from Senegal
Per Capita Income
Per Capita Income Comparison
Luxembourgers
Immigrants from Senegal
$45,663
PER CAPITA INCOME
90.4/ 100
METRIC RATING
129th/ 347
METRIC RANK
$41,830
PER CAPITA INCOME
11.3/ 100
METRIC RATING
212th/ 347
METRIC RANK
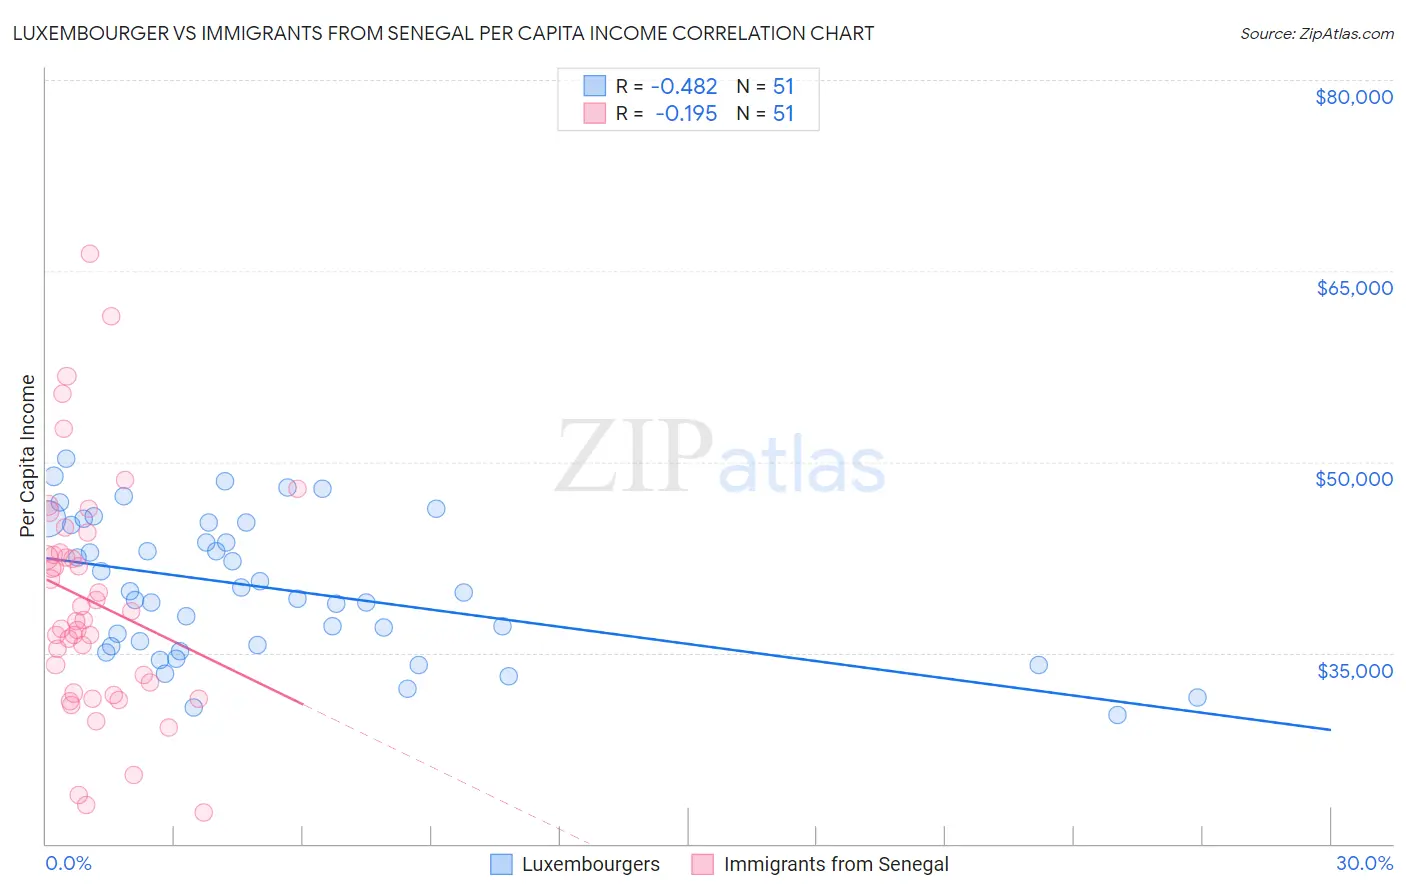
Luxembourger vs Immigrants from Senegal Per Capita Income Correlation Chart
The statistical analysis conducted on geographies consisting of 144,682,505 people shows a moderate negative correlation between the proportion of Luxembourgers and per capita income in the United States with a correlation coefficient (R) of -0.482 and weighted average of $45,663. Similarly, the statistical analysis conducted on geographies consisting of 90,129,295 people shows a poor negative correlation between the proportion of Immigrants from Senegal and per capita income in the United States with a correlation coefficient (R) of -0.195 and weighted average of $41,830, a difference of 9.2%.
Per Capita Income Correlation Summary
| Measurement | Luxembourger | Immigrants from Senegal |
| Minimum | $30,080 | $22,459 |
| Maximum | $50,248 | $66,378 |
| Range | $20,168 | $43,919 |
| Mean | $40,097 | $39,027 |
| Median | $39,752 | $37,536 |
| Interquartile 25% (IQ1) | $35,555 | $31,835 |
| Interquartile 75% (IQ3) | $45,199 | $42,907 |
| Interquartile Range (IQR) | $9,644 | $11,072 |
| Standard Deviation (Sample) | $5,390 | $9,175 |
| Standard Deviation (Population) | $5,337 | $9,085 |
Similar Demographics by Per Capita Income
Demographics Similar to Luxembourgers by Per Capita Income
In terms of per capita income, the demographic groups most similar to Luxembourgers are Arab ($45,662, a difference of 0.0%), Immigrants from North Macedonia ($45,622, a difference of 0.090%), Jordanian ($45,605, a difference of 0.13%), Pakistani ($45,587, a difference of 0.17%), and Slovene ($45,581, a difference of 0.18%).
| Demographics | Rating | Rank | Per Capita Income |
| Moroccans | 92.1 /100 | #122 | Exceptional $45,854 |
| Lebanese | 92.0 /100 | #123 | Exceptional $45,840 |
| Europeans | 92.0 /100 | #124 | Exceptional $45,836 |
| Zimbabweans | 91.7 /100 | #125 | Exceptional $45,804 |
| Palestinians | 91.6 /100 | #126 | Exceptional $45,790 |
| Immigrants | Germany | 91.3 /100 | #127 | Exceptional $45,751 |
| Swedes | 91.3 /100 | #128 | Exceptional $45,750 |
| Luxembourgers | 90.4 /100 | #129 | Exceptional $45,663 |
| Arabs | 90.4 /100 | #130 | Exceptional $45,662 |
| Immigrants | North Macedonia | 90.0 /100 | #131 | Exceptional $45,622 |
| Jordanians | 89.9 /100 | #132 | Excellent $45,605 |
| Pakistanis | 89.7 /100 | #133 | Excellent $45,587 |
| Slovenes | 89.6 /100 | #134 | Excellent $45,581 |
| Hungarians | 87.9 /100 | #135 | Excellent $45,426 |
| Immigrants | Oceania | 85.2 /100 | #136 | Excellent $45,220 |
Demographics Similar to Immigrants from Senegal by Per Capita Income
In terms of per capita income, the demographic groups most similar to Immigrants from Senegal are Immigrants from Panama ($41,853, a difference of 0.050%), Immigrants from Venezuela ($41,727, a difference of 0.25%), Immigrants from Bangladesh ($41,709, a difference of 0.29%), Ecuadorian ($41,958, a difference of 0.30%), and Sudanese ($41,695, a difference of 0.32%).
| Demographics | Rating | Rank | Per Capita Income |
| Whites/Caucasians | 15.9 /100 | #205 | Poor $42,180 |
| Ghanaians | 15.7 /100 | #206 | Poor $42,164 |
| Venezuelans | 14.4 /100 | #207 | Poor $42,074 |
| Panamanians | 13.9 /100 | #208 | Poor $42,035 |
| Immigrants | Sudan | 13.2 /100 | #209 | Poor $41,986 |
| Ecuadorians | 12.9 /100 | #210 | Poor $41,958 |
| Immigrants | Panama | 11.6 /100 | #211 | Poor $41,853 |
| Immigrants | Senegal | 11.3 /100 | #212 | Poor $41,830 |
| Immigrants | Venezuela | 10.2 /100 | #213 | Poor $41,727 |
| Immigrants | Bangladesh | 10.1 /100 | #214 | Poor $41,709 |
| Sudanese | 9.9 /100 | #215 | Tragic $41,695 |
| Tongans | 9.9 /100 | #216 | Tragic $41,693 |
| Guamanians/Chamorros | 9.7 /100 | #217 | Tragic $41,678 |
| Trinidadians and Tobagonians | 9.5 /100 | #218 | Tragic $41,655 |
| Puget Sound Salish | 8.1 /100 | #219 | Tragic $41,495 |