Luxembourger vs Immigrants from Nepal Median Household Income
COMPARE
Luxembourger
Immigrants from Nepal
Median Household Income
Median Household Income Comparison
Luxembourgers
Immigrants from Nepal
$86,418
MEDIAN HOUSEHOLD INCOME
70.0/ 100
METRIC RATING
160th/ 347
METRIC RANK
$87,046
MEDIAN HOUSEHOLD INCOME
77.7/ 100
METRIC RATING
149th/ 347
METRIC RANK
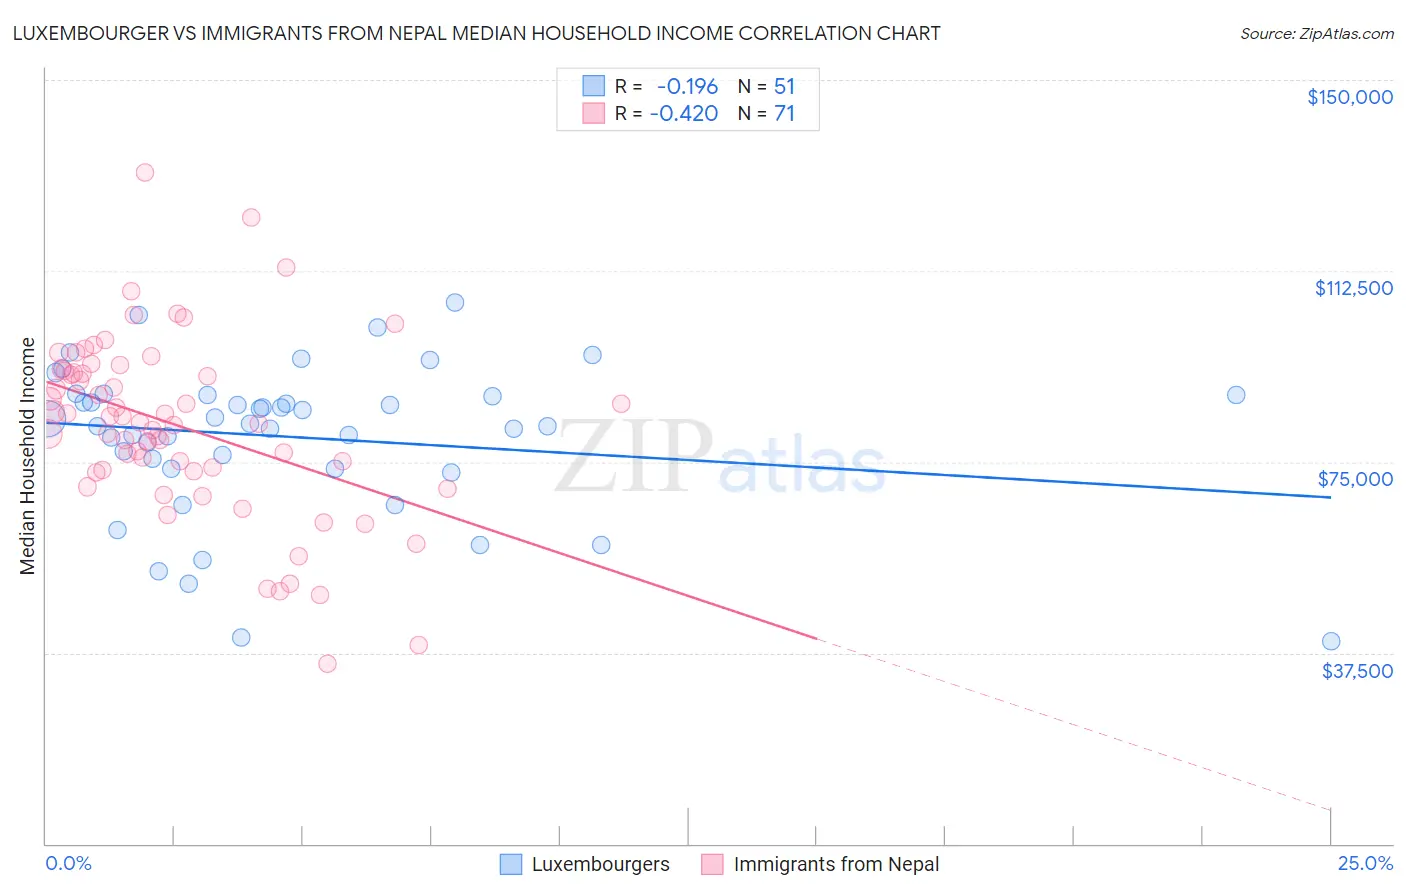
Luxembourger vs Immigrants from Nepal Median Household Income Correlation Chart
The statistical analysis conducted on geographies consisting of 144,630,176 people shows a poor negative correlation between the proportion of Luxembourgers and median household income in the United States with a correlation coefficient (R) of -0.196 and weighted average of $86,418. Similarly, the statistical analysis conducted on geographies consisting of 186,662,148 people shows a moderate negative correlation between the proportion of Immigrants from Nepal and median household income in the United States with a correlation coefficient (R) of -0.420 and weighted average of $87,046, a difference of 0.73%.
Median Household Income Correlation Summary
| Measurement | Luxembourger | Immigrants from Nepal |
| Minimum | $39,750 | $35,329 |
| Maximum | $106,423 | $131,777 |
| Range | $66,673 | $96,448 |
| Mean | $79,856 | $81,976 |
| Median | $82,566 | $82,737 |
| Interquartile 25% (IQ1) | $73,750 | $73,125 |
| Interquartile 75% (IQ3) | $88,077 | $92,873 |
| Interquartile Range (IQR) | $14,327 | $19,748 |
| Standard Deviation (Sample) | $14,707 | $17,803 |
| Standard Deviation (Population) | $14,562 | $17,677 |
Demographics Similar to Luxembourgers and Immigrants from Nepal by Median Household Income
In terms of median household income, the demographic groups most similar to Luxembourgers are Immigrants from Uzbekistan ($86,425, a difference of 0.010%), Slavic ($86,398, a difference of 0.020%), Moroccan ($86,468, a difference of 0.060%), Samoan ($86,498, a difference of 0.090%), and Immigrants from Albania ($86,534, a difference of 0.13%). Similarly, the demographic groups most similar to Immigrants from Nepal are Basque ($87,001, a difference of 0.050%), Hungarian ($86,920, a difference of 0.15%), Immigrants from Saudi Arabia ($86,875, a difference of 0.20%), Costa Rican ($87,262, a difference of 0.25%), and South American ($86,824, a difference of 0.26%).
| Demographics | Rating | Rank | Median Household Income |
| Serbians | 83.0 /100 | #144 | Excellent $87,572 |
| Ugandans | 82.9 /100 | #145 | Excellent $87,557 |
| Immigrants | Uganda | 82.8 /100 | #146 | Excellent $87,553 |
| South American Indians | 81.8 /100 | #147 | Excellent $87,446 |
| Costa Ricans | 80.0 /100 | #148 | Excellent $87,262 |
| Immigrants | Nepal | 77.7 /100 | #149 | Good $87,046 |
| Basques | 77.2 /100 | #150 | Good $87,001 |
| Hungarians | 76.3 /100 | #151 | Good $86,920 |
| Immigrants | Saudi Arabia | 75.8 /100 | #152 | Good $86,875 |
| South Americans | 75.1 /100 | #153 | Good $86,824 |
| Immigrants | Germany | 74.4 /100 | #154 | Good $86,764 |
| Carpatho Rusyns | 72.8 /100 | #155 | Good $86,635 |
| Immigrants | Albania | 71.5 /100 | #156 | Good $86,534 |
| Samoans | 71.0 /100 | #157 | Good $86,498 |
| Moroccans | 70.6 /100 | #158 | Good $86,468 |
| Immigrants | Uzbekistan | 70.1 /100 | #159 | Good $86,425 |
| Luxembourgers | 70.0 /100 | #160 | Good $86,418 |
| Slavs | 69.7 /100 | #161 | Good $86,398 |
| Guamanians/Chamorros | 67.7 /100 | #162 | Good $86,255 |
| Czechs | 66.4 /100 | #163 | Good $86,164 |
| Irish | 66.2 /100 | #164 | Good $86,145 |