Liberian vs Immigrants from India Median Female Earnings
COMPARE
Liberian
Immigrants from India
Median Female Earnings
Median Female Earnings Comparison
Liberians
Immigrants from India
$38,215
MEDIAN FEMALE EARNINGS
4.4/ 100
METRIC RATING
236th/ 347
METRIC RANK
$48,292
MEDIAN FEMALE EARNINGS
100.0/ 100
METRIC RATING
4th/ 347
METRIC RANK
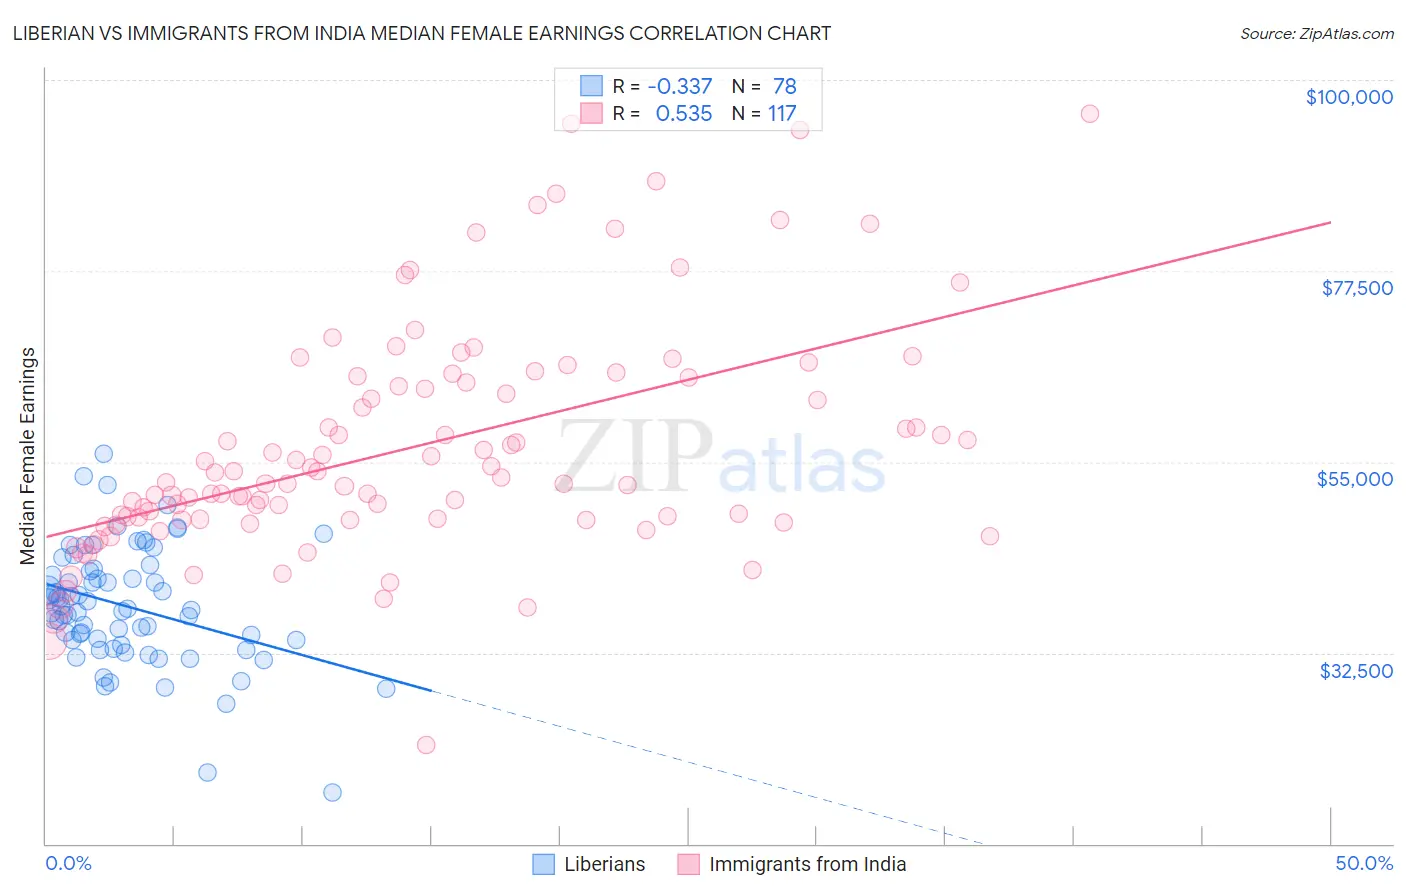
Liberian vs Immigrants from India Median Female Earnings Correlation Chart
The statistical analysis conducted on geographies consisting of 118,095,616 people shows a mild negative correlation between the proportion of Liberians and median female earnings in the United States with a correlation coefficient (R) of -0.337 and weighted average of $38,215. Similarly, the statistical analysis conducted on geographies consisting of 433,961,093 people shows a substantial positive correlation between the proportion of Immigrants from India and median female earnings in the United States with a correlation coefficient (R) of 0.535 and weighted average of $48,292, a difference of 26.4%.
Median Female Earnings Correlation Summary
| Measurement | Liberian | Immigrants from India |
| Minimum | $16,076 | $21,591 |
| Maximum | $56,012 | $96,063 |
| Range | $39,936 | $74,472 |
| Mean | $37,973 | $56,646 |
| Median | $37,624 | $52,549 |
| Interquartile 25% (IQ1) | $33,939 | $48,205 |
| Interquartile 75% (IQ3) | $42,173 | $64,667 |
| Interquartile Range (IQR) | $8,234 | $16,462 |
| Standard Deviation (Sample) | $6,991 | $13,523 |
| Standard Deviation (Population) | $6,946 | $13,465 |
Similar Demographics by Median Female Earnings
Demographics Similar to Liberians by Median Female Earnings
In terms of median female earnings, the demographic groups most similar to Liberians are Sudanese ($38,215, a difference of 0.0%), Immigrants from Cabo Verde ($38,208, a difference of 0.020%), Alaska Native ($38,202, a difference of 0.030%), English ($38,196, a difference of 0.050%), and Finnish ($38,173, a difference of 0.11%).
| Demographics | Rating | Rank | Median Female Earnings |
| Belgians | 6.1 /100 | #229 | Tragic $38,382 |
| Basques | 5.7 /100 | #230 | Tragic $38,352 |
| Somalis | 5.5 /100 | #231 | Tragic $38,333 |
| Scandinavians | 5.2 /100 | #232 | Tragic $38,306 |
| Tongans | 5.1 /100 | #233 | Tragic $38,288 |
| Celtics | 5.0 /100 | #234 | Tragic $38,283 |
| Sudanese | 4.4 /100 | #235 | Tragic $38,215 |
| Liberians | 4.4 /100 | #236 | Tragic $38,215 |
| Immigrants | Cabo Verde | 4.3 /100 | #237 | Tragic $38,208 |
| Alaska Natives | 4.3 /100 | #238 | Tragic $38,202 |
| English | 4.2 /100 | #239 | Tragic $38,196 |
| Finns | 4.0 /100 | #240 | Tragic $38,173 |
| Spanish | 3.5 /100 | #241 | Tragic $38,098 |
| Immigrants | Burma/Myanmar | 3.0 /100 | #242 | Tragic $38,028 |
| Germans | 2.8 /100 | #243 | Tragic $37,986 |
Demographics Similar to Immigrants from India by Median Female Earnings
In terms of median female earnings, the demographic groups most similar to Immigrants from India are Immigrants from Singapore ($47,986, a difference of 0.64%), Immigrants from Ireland ($47,598, a difference of 1.5%), Thai ($47,577, a difference of 1.5%), Iranian ($47,421, a difference of 1.8%), and Immigrants from Taiwan ($49,256, a difference of 2.0%).
| Demographics | Rating | Rank | Median Female Earnings |
| Immigrants | Hong Kong | 100.0 /100 | #1 | Exceptional $49,818 |
| Filipinos | 100.0 /100 | #2 | Exceptional $49,508 |
| Immigrants | Taiwan | 100.0 /100 | #3 | Exceptional $49,256 |
| Immigrants | India | 100.0 /100 | #4 | Exceptional $48,292 |
| Immigrants | Singapore | 100.0 /100 | #5 | Exceptional $47,986 |
| Immigrants | Ireland | 100.0 /100 | #6 | Exceptional $47,598 |
| Thais | 100.0 /100 | #7 | Exceptional $47,577 |
| Iranians | 100.0 /100 | #8 | Exceptional $47,421 |
| Immigrants | Iran | 100.0 /100 | #9 | Exceptional $47,154 |
| Immigrants | China | 100.0 /100 | #10 | Exceptional $46,972 |
| Okinawans | 100.0 /100 | #11 | Exceptional $46,905 |
| Immigrants | Israel | 100.0 /100 | #12 | Exceptional $46,902 |
| Immigrants | Australia | 100.0 /100 | #13 | Exceptional $46,573 |
| Soviet Union | 100.0 /100 | #14 | Exceptional $46,556 |
| Immigrants | Eastern Asia | 100.0 /100 | #15 | Exceptional $46,502 |