Liberian vs Cape Verdean Median Family Income
COMPARE
Liberian
Cape Verdean
Median Family Income
Median Family Income Comparison
Liberians
Cape Verdeans
$91,722
MEDIAN FAMILY INCOME
0.4/ 100
METRIC RATING
262nd/ 347
METRIC RANK
$91,848
MEDIAN FAMILY INCOME
0.4/ 100
METRIC RATING
259th/ 347
METRIC RANK
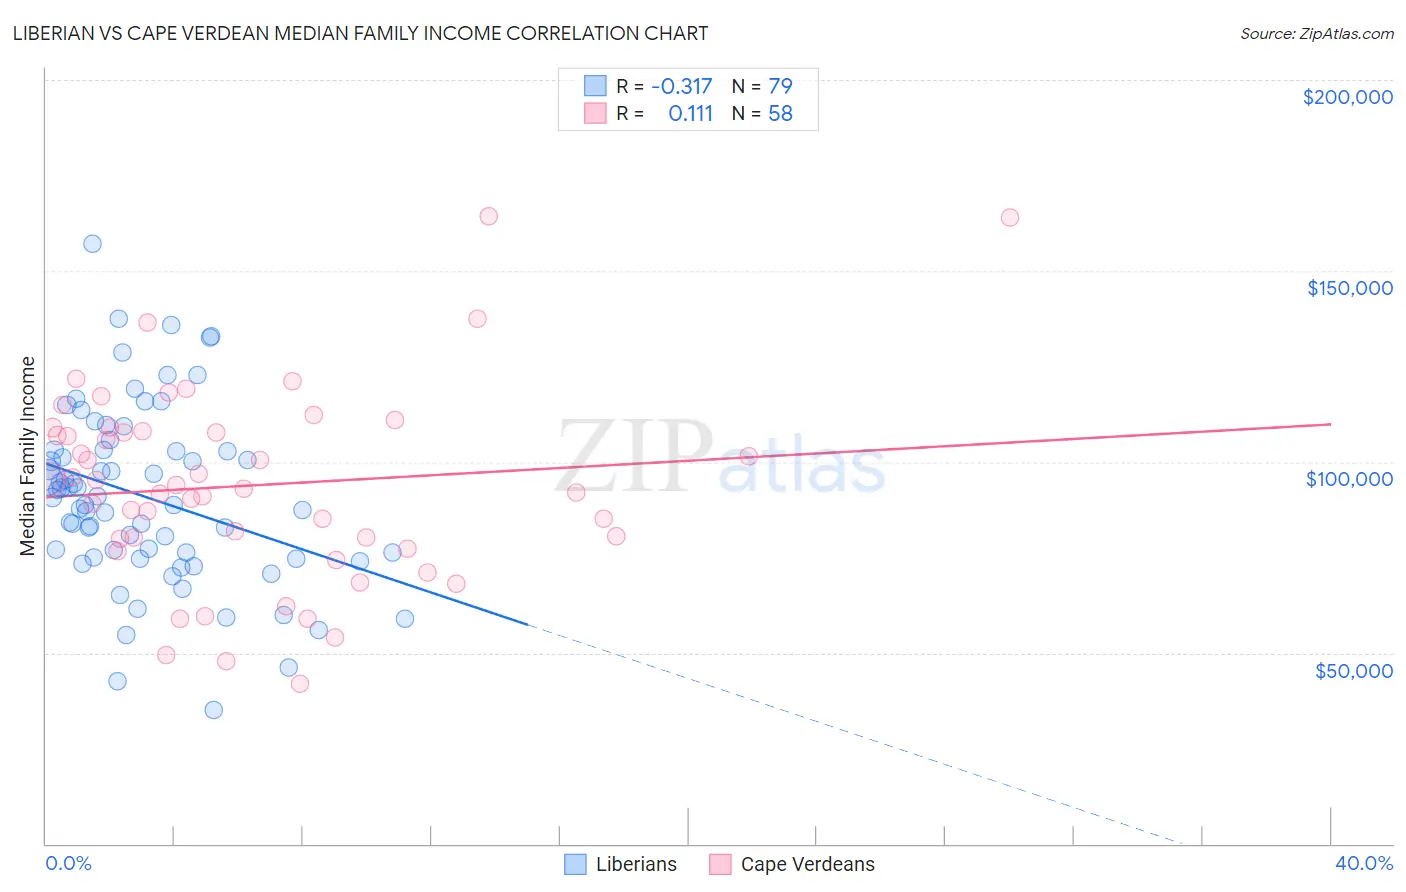
Liberian vs Cape Verdean Median Family Income Correlation Chart
The statistical analysis conducted on geographies consisting of 118,024,273 people shows a mild negative correlation between the proportion of Liberians and median family income in the United States with a correlation coefficient (R) of -0.317 and weighted average of $91,722. Similarly, the statistical analysis conducted on geographies consisting of 107,530,088 people shows a poor positive correlation between the proportion of Cape Verdeans and median family income in the United States with a correlation coefficient (R) of 0.111 and weighted average of $91,848, a difference of 0.14%.
Median Family Income Correlation Summary
| Measurement | Liberian | Cape Verdean |
| Minimum | $34,978 | $41,875 |
| Maximum | $157,083 | $164,351 |
| Range | $122,105 | $122,476 |
| Mean | $90,813 | $93,845 |
| Median | $90,810 | $93,404 |
| Interquartile 25% (IQ1) | $74,960 | $79,783 |
| Interquartile 75% (IQ3) | $103,000 | $107,913 |
| Interquartile Range (IQR) | $28,040 | $28,129 |
| Standard Deviation (Sample) | $23,045 | $25,352 |
| Standard Deviation (Population) | $22,899 | $25,133 |
Demographics Similar to Liberians and Cape Verdeans by Median Family Income
In terms of median family income, the demographic groups most similar to Liberians are Inupiat ($91,730, a difference of 0.010%), Pennsylvania German ($91,763, a difference of 0.040%), Immigrants from West Indies ($91,588, a difference of 0.15%), Osage ($91,926, a difference of 0.22%), and Senegalese ($91,475, a difference of 0.27%). Similarly, the demographic groups most similar to Cape Verdeans are Osage ($91,926, a difference of 0.090%), Pennsylvania German ($91,763, a difference of 0.090%), Inupiat ($91,730, a difference of 0.13%), American ($92,096, a difference of 0.27%), and Immigrants from West Indies ($91,588, a difference of 0.28%).
| Demographics | Rating | Rank | Median Family Income |
| West Indians | 0.6 /100 | #250 | Tragic $92,765 |
| Immigrants | Somalia | 0.6 /100 | #251 | Tragic $92,609 |
| Immigrants | El Salvador | 0.6 /100 | #252 | Tragic $92,545 |
| Immigrants | Guyana | 0.6 /100 | #253 | Tragic $92,513 |
| Immigrants | Barbados | 0.5 /100 | #254 | Tragic $92,419 |
| Immigrants | Laos | 0.5 /100 | #255 | Tragic $92,239 |
| Nicaraguans | 0.5 /100 | #256 | Tragic $92,231 |
| Americans | 0.4 /100 | #257 | Tragic $92,096 |
| Osage | 0.4 /100 | #258 | Tragic $91,926 |
| Cape Verdeans | 0.4 /100 | #259 | Tragic $91,848 |
| Pennsylvania Germans | 0.4 /100 | #260 | Tragic $91,763 |
| Inupiat | 0.4 /100 | #261 | Tragic $91,730 |
| Liberians | 0.4 /100 | #262 | Tragic $91,722 |
| Immigrants | West Indies | 0.3 /100 | #263 | Tragic $91,588 |
| Senegalese | 0.3 /100 | #264 | Tragic $91,475 |
| Hmong | 0.3 /100 | #265 | Tragic $91,296 |
| Central Americans | 0.3 /100 | #266 | Tragic $91,087 |
| Mexican American Indians | 0.2 /100 | #267 | Tragic $90,918 |
| Cree | 0.2 /100 | #268 | Tragic $90,882 |
| Belizeans | 0.2 /100 | #269 | Tragic $90,880 |
| Jamaicans | 0.2 /100 | #270 | Tragic $90,581 |