Lebanese vs Hungarian Median Female Earnings
COMPARE
Lebanese
Hungarian
Median Female Earnings
Median Female Earnings Comparison
Lebanese
Hungarians
$40,006
MEDIAN FEMALE EARNINGS
65.5/ 100
METRIC RATING
163rd/ 347
METRIC RANK
$39,510
MEDIAN FEMALE EARNINGS
40.3/ 100
METRIC RATING
183rd/ 347
METRIC RANK
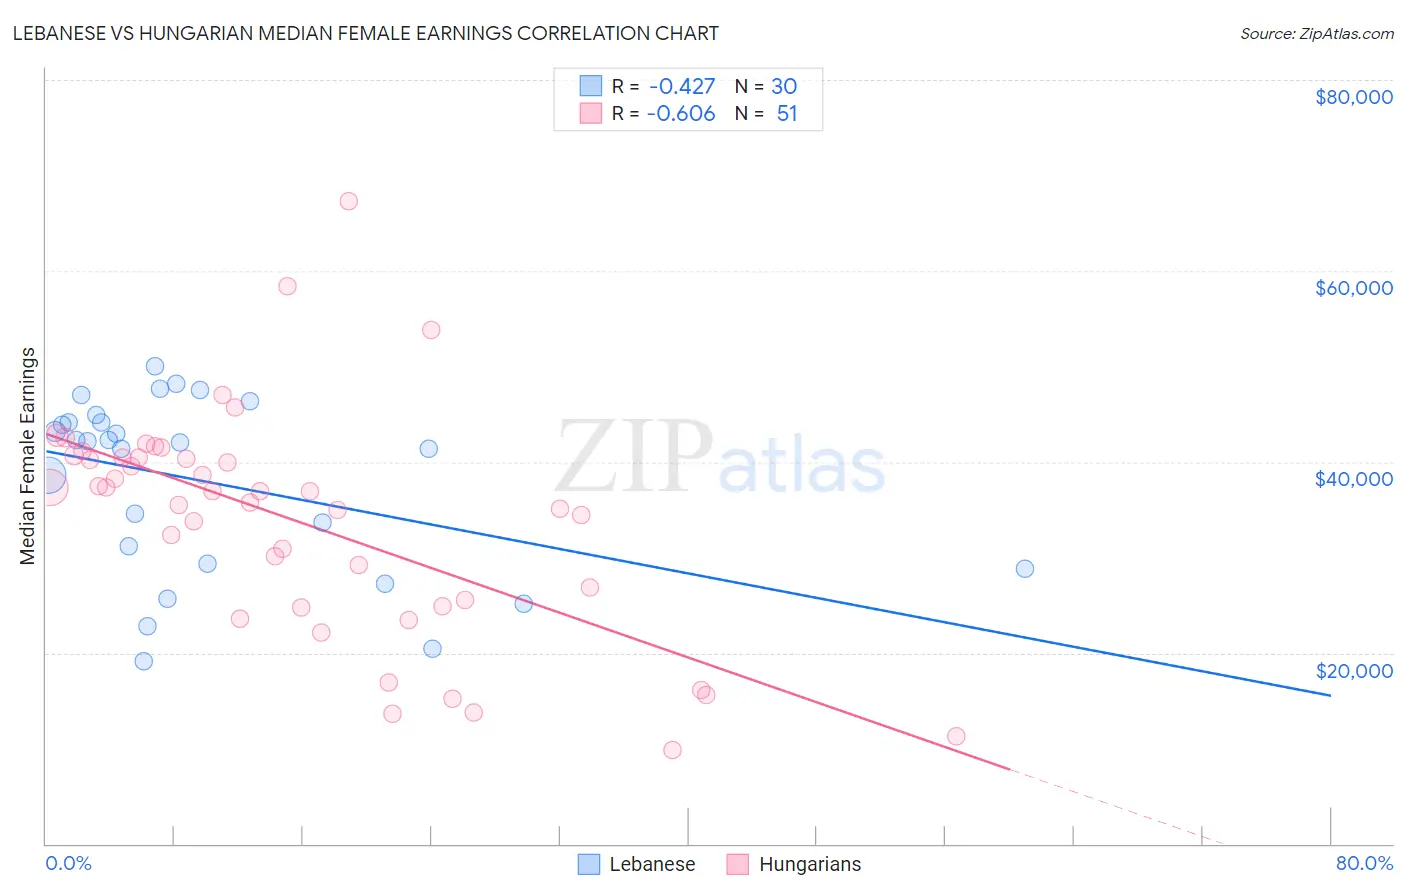
Lebanese vs Hungarian Median Female Earnings Correlation Chart
The statistical analysis conducted on geographies consisting of 401,457,722 people shows a moderate negative correlation between the proportion of Lebanese and median female earnings in the United States with a correlation coefficient (R) of -0.427 and weighted average of $40,006. Similarly, the statistical analysis conducted on geographies consisting of 485,733,652 people shows a significant negative correlation between the proportion of Hungarians and median female earnings in the United States with a correlation coefficient (R) of -0.606 and weighted average of $39,510, a difference of 1.3%.
Median Female Earnings Correlation Summary
| Measurement | Lebanese | Hungarian |
| Minimum | $19,128 | $9,845 |
| Maximum | $50,050 | $67,329 |
| Range | $30,922 | $57,484 |
| Mean | $37,921 | $33,736 |
| Median | $42,088 | $36,875 |
| Interquartile 25% (IQ1) | $29,289 | $24,845 |
| Interquartile 75% (IQ3) | $44,167 | $40,519 |
| Interquartile Range (IQR) | $14,878 | $15,674 |
| Standard Deviation (Sample) | $9,199 | $11,915 |
| Standard Deviation (Population) | $9,044 | $11,798 |
Demographics Similar to Lebanese and Hungarians by Median Female Earnings
In terms of median female earnings, the demographic groups most similar to Lebanese are Immigrants from Saudi Arabia ($39,952, a difference of 0.14%), Immigrants from Bangladesh ($39,910, a difference of 0.24%), Immigrants from Ghana ($39,894, a difference of 0.28%), Luxembourger ($39,891, a difference of 0.29%), and Immigrants from Peru ($39,871, a difference of 0.34%). Similarly, the demographic groups most similar to Hungarians are Tlingit-Haida ($39,513, a difference of 0.010%), Tsimshian ($39,530, a difference of 0.050%), Immigrants from Kenya ($39,535, a difference of 0.060%), Immigrants from Germany ($39,603, a difference of 0.24%), and Slavic ($39,613, a difference of 0.26%).
| Demographics | Rating | Rank | Median Female Earnings |
| Lebanese | 65.5 /100 | #163 | Good $40,006 |
| Immigrants | Saudi Arabia | 62.9 /100 | #164 | Good $39,952 |
| Immigrants | Bangladesh | 60.8 /100 | #165 | Good $39,910 |
| Immigrants | Ghana | 60.0 /100 | #166 | Good $39,894 |
| Luxembourgers | 59.9 /100 | #167 | Average $39,891 |
| Immigrants | Peru | 58.9 /100 | #168 | Average $39,871 |
| Kenyans | 58.4 /100 | #169 | Average $39,860 |
| Slovenes | 56.2 /100 | #170 | Average $39,817 |
| Immigrants | Portugal | 54.7 /100 | #171 | Average $39,788 |
| British | 53.8 /100 | #172 | Average $39,772 |
| Canadians | 51.4 /100 | #173 | Average $39,724 |
| South Americans | 50.0 /100 | #174 | Average $39,698 |
| Immigrants | South America | 47.2 /100 | #175 | Average $39,643 |
| Nigerians | 47.0 /100 | #176 | Average $39,641 |
| Costa Ricans | 46.1 /100 | #177 | Average $39,622 |
| Slavs | 45.6 /100 | #178 | Average $39,613 |
| Immigrants | Germany | 45.1 /100 | #179 | Average $39,603 |
| Immigrants | Kenya | 41.6 /100 | #180 | Average $39,535 |
| Tsimshian | 41.4 /100 | #181 | Average $39,530 |
| Tlingit-Haida | 40.5 /100 | #182 | Average $39,513 |
| Hungarians | 40.3 /100 | #183 | Average $39,510 |