Laotian vs Samoan Householder Income Under 25 years
COMPARE
Laotian
Samoan
Householder Income Under 25 years
Householder Income Under 25 years Comparison
Laotians
Samoans
$54,369
HOUSEHOLDER INCOME UNDER 25 YEARS
99.5/ 100
METRIC RATING
83rd/ 347
METRIC RANK
$54,610
HOUSEHOLDER INCOME UNDER 25 YEARS
99.7/ 100
METRIC RATING
69th/ 347
METRIC RANK
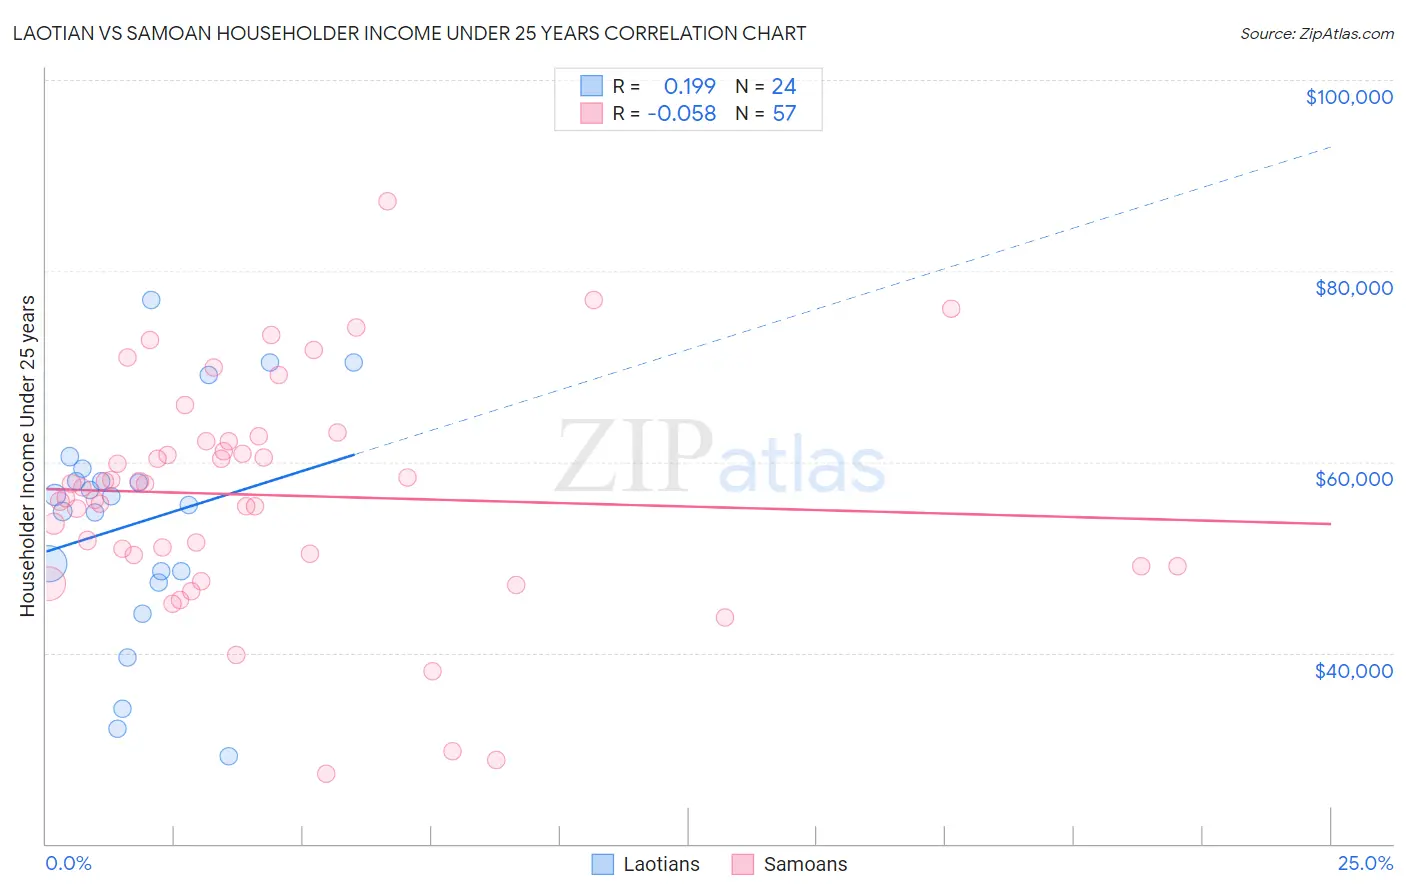
Laotian vs Samoan Householder Income Under 25 years Correlation Chart
The statistical analysis conducted on geographies consisting of 201,813,487 people shows a poor positive correlation between the proportion of Laotians and household income with householder under the age of 25 in the United States with a correlation coefficient (R) of 0.199 and weighted average of $54,369. Similarly, the statistical analysis conducted on geographies consisting of 203,672,392 people shows a slight negative correlation between the proportion of Samoans and household income with householder under the age of 25 in the United States with a correlation coefficient (R) of -0.058 and weighted average of $54,610, a difference of 0.44%.
Householder Income Under 25 years Correlation Summary
| Measurement | Laotian | Samoan |
| Minimum | $29,129 | $27,292 |
| Maximum | $76,932 | $87,292 |
| Range | $47,803 | $60,000 |
| Mean | $53,668 | $56,497 |
| Median | $55,928 | $57,308 |
| Interquartile 25% (IQ1) | $47,909 | $49,619 |
| Interquartile 75% (IQ3) | $58,617 | $62,190 |
| Interquartile Range (IQR) | $10,708 | $12,572 |
| Standard Deviation (Sample) | $12,091 | $11,785 |
| Standard Deviation (Population) | $11,836 | $11,681 |
Demographics Similar to Laotians and Samoans by Householder Income Under 25 years
In terms of householder income under 25 years, the demographic groups most similar to Laotians are Bulgarian ($54,352, a difference of 0.030%), Immigrants from Czechoslovakia ($54,352, a difference of 0.030%), Russian ($54,389, a difference of 0.040%), Immigrants from Croatia ($54,343, a difference of 0.050%), and Portuguese ($54,436, a difference of 0.12%). Similarly, the demographic groups most similar to Samoans are Immigrants from El Salvador ($54,599, a difference of 0.020%), Immigrants from Morocco ($54,593, a difference of 0.030%), Tsimshian ($54,649, a difference of 0.070%), Immigrants from Northern Europe ($54,571, a difference of 0.070%), and Macedonian ($54,563, a difference of 0.090%).
| Demographics | Rating | Rank | Householder Income Under 25 years |
| Immigrants | Bangladesh | 99.8 /100 | #66 | Exceptional $54,714 |
| Okinawans | 99.8 /100 | #67 | Exceptional $54,701 |
| Tsimshian | 99.8 /100 | #68 | Exceptional $54,649 |
| Samoans | 99.7 /100 | #69 | Exceptional $54,610 |
| Immigrants | El Salvador | 99.7 /100 | #70 | Exceptional $54,599 |
| Immigrants | Morocco | 99.7 /100 | #71 | Exceptional $54,593 |
| Immigrants | Northern Europe | 99.7 /100 | #72 | Exceptional $54,571 |
| Macedonians | 99.7 /100 | #73 | Exceptional $54,563 |
| Immigrants | Grenada | 99.7 /100 | #74 | Exceptional $54,538 |
| Immigrants | Sri Lanka | 99.7 /100 | #75 | Exceptional $54,512 |
| Immigrants | Brazil | 99.6 /100 | #76 | Exceptional $54,487 |
| Immigrants | Southern Europe | 99.6 /100 | #77 | Exceptional $54,484 |
| Nepalese | 99.6 /100 | #78 | Exceptional $54,472 |
| Immigrants | Italy | 99.6 /100 | #79 | Exceptional $54,449 |
| Egyptians | 99.6 /100 | #80 | Exceptional $54,444 |
| Portuguese | 99.6 /100 | #81 | Exceptional $54,436 |
| Russians | 99.5 /100 | #82 | Exceptional $54,389 |
| Laotians | 99.5 /100 | #83 | Exceptional $54,369 |
| Bulgarians | 99.5 /100 | #84 | Exceptional $54,352 |
| Immigrants | Czechoslovakia | 99.5 /100 | #85 | Exceptional $54,352 |
| Immigrants | Croatia | 99.5 /100 | #86 | Exceptional $54,343 |