Laotian vs Immigrants from Saudi Arabia Median Earnings
COMPARE
Laotian
Immigrants from Saudi Arabia
Median Earnings
Median Earnings Comparison
Laotians
Immigrants from Saudi Arabia
$50,343
MEDIAN EARNINGS
99.6/ 100
METRIC RATING
79th/ 347
METRIC RANK
$47,704
MEDIAN EARNINGS
85.6/ 100
METRIC RATING
145th/ 347
METRIC RANK
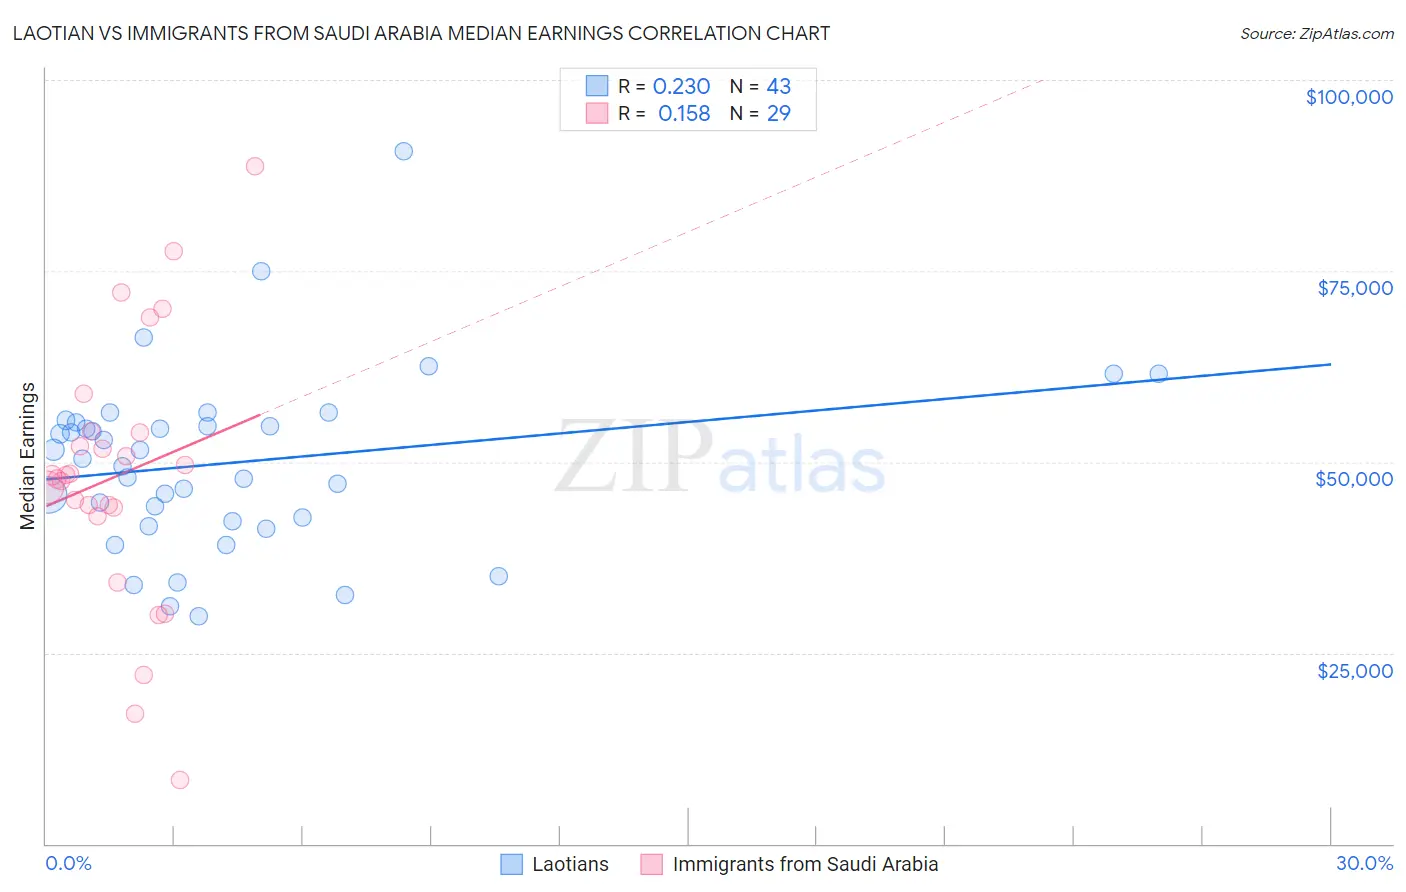
Laotian vs Immigrants from Saudi Arabia Median Earnings Correlation Chart
The statistical analysis conducted on geographies consisting of 224,848,117 people shows a weak positive correlation between the proportion of Laotians and median earnings in the United States with a correlation coefficient (R) of 0.230 and weighted average of $50,343. Similarly, the statistical analysis conducted on geographies consisting of 164,295,886 people shows a poor positive correlation between the proportion of Immigrants from Saudi Arabia and median earnings in the United States with a correlation coefficient (R) of 0.158 and weighted average of $47,704, a difference of 5.5%.
Median Earnings Correlation Summary
| Measurement | Laotian | Immigrants from Saudi Arabia |
| Minimum | $29,751 | $8,283 |
| Maximum | $90,729 | $88,678 |
| Range | $60,978 | $80,395 |
| Mean | $49,880 | $48,188 |
| Median | $50,359 | $48,225 |
| Interquartile 25% (IQ1) | $42,206 | $43,477 |
| Interquartile 75% (IQ3) | $55,106 | $53,983 |
| Interquartile Range (IQR) | $12,900 | $10,507 |
| Standard Deviation (Sample) | $11,670 | $17,307 |
| Standard Deviation (Population) | $11,533 | $17,006 |
Similar Demographics by Median Earnings
Demographics Similar to Laotians by Median Earnings
In terms of median earnings, the demographic groups most similar to Laotians are Ukrainian ($50,320, a difference of 0.050%), Argentinean ($50,399, a difference of 0.11%), Immigrants from Southern Europe ($50,280, a difference of 0.12%), Immigrants from Moldova ($50,274, a difference of 0.14%), and Romanian ($50,244, a difference of 0.20%).
| Demographics | Rating | Rank | Median Earnings |
| Immigrants | Egypt | 99.8 /100 | #72 | Exceptional $50,901 |
| Immigrants | Netherlands | 99.8 /100 | #73 | Exceptional $50,818 |
| South Africans | 99.8 /100 | #74 | Exceptional $50,752 |
| Immigrants | Scotland | 99.8 /100 | #75 | Exceptional $50,741 |
| Immigrants | Italy | 99.7 /100 | #76 | Exceptional $50,581 |
| Immigrants | Western Europe | 99.7 /100 | #77 | Exceptional $50,549 |
| Argentineans | 99.6 /100 | #78 | Exceptional $50,399 |
| Laotians | 99.6 /100 | #79 | Exceptional $50,343 |
| Ukrainians | 99.6 /100 | #80 | Exceptional $50,320 |
| Immigrants | Southern Europe | 99.6 /100 | #81 | Exceptional $50,280 |
| Immigrants | Moldova | 99.5 /100 | #82 | Exceptional $50,274 |
| Romanians | 99.5 /100 | #83 | Exceptional $50,244 |
| Immigrants | Hungary | 99.5 /100 | #84 | Exceptional $50,227 |
| Immigrants | Kazakhstan | 99.5 /100 | #85 | Exceptional $50,225 |
| Immigrants | Canada | 99.5 /100 | #86 | Exceptional $50,192 |
Demographics Similar to Immigrants from Saudi Arabia by Median Earnings
In terms of median earnings, the demographic groups most similar to Immigrants from Saudi Arabia are Immigrants from Chile ($47,697, a difference of 0.010%), Immigrants from South Eastern Asia ($47,671, a difference of 0.070%), Immigrants from Eritrea ($47,657, a difference of 0.10%), Luxembourger ($47,640, a difference of 0.14%), and Peruvian ($47,628, a difference of 0.16%).
| Demographics | Rating | Rank | Median Earnings |
| Europeans | 88.9 /100 | #138 | Excellent $47,915 |
| Canadians | 88.8 /100 | #139 | Excellent $47,911 |
| Taiwanese | 88.7 /100 | #140 | Excellent $47,902 |
| Immigrants | Sierra Leone | 88.3 /100 | #141 | Excellent $47,875 |
| Ugandans | 88.0 /100 | #142 | Excellent $47,854 |
| Swedes | 88.0 /100 | #143 | Excellent $47,851 |
| Hungarians | 87.1 /100 | #144 | Excellent $47,795 |
| Immigrants | Saudi Arabia | 85.6 /100 | #145 | Excellent $47,704 |
| Immigrants | Chile | 85.5 /100 | #146 | Excellent $47,697 |
| Immigrants | South Eastern Asia | 85.0 /100 | #147 | Excellent $47,671 |
| Immigrants | Eritrea | 84.8 /100 | #148 | Excellent $47,657 |
| Luxembourgers | 84.5 /100 | #149 | Excellent $47,640 |
| Peruvians | 84.2 /100 | #150 | Excellent $47,628 |
| Immigrants | Oceania | 84.1 /100 | #151 | Excellent $47,617 |
| Immigrants | Germany | 83.1 /100 | #152 | Excellent $47,566 |