Korean vs South African Median Earnings
COMPARE
Korean
South African
Median Earnings
Median Earnings Comparison
Koreans
South Africans
$48,727
MEDIAN EARNINGS
96.2/ 100
METRIC RATING
116th/ 347
METRIC RANK
$50,752
MEDIAN EARNINGS
99.8/ 100
METRIC RATING
74th/ 347
METRIC RANK
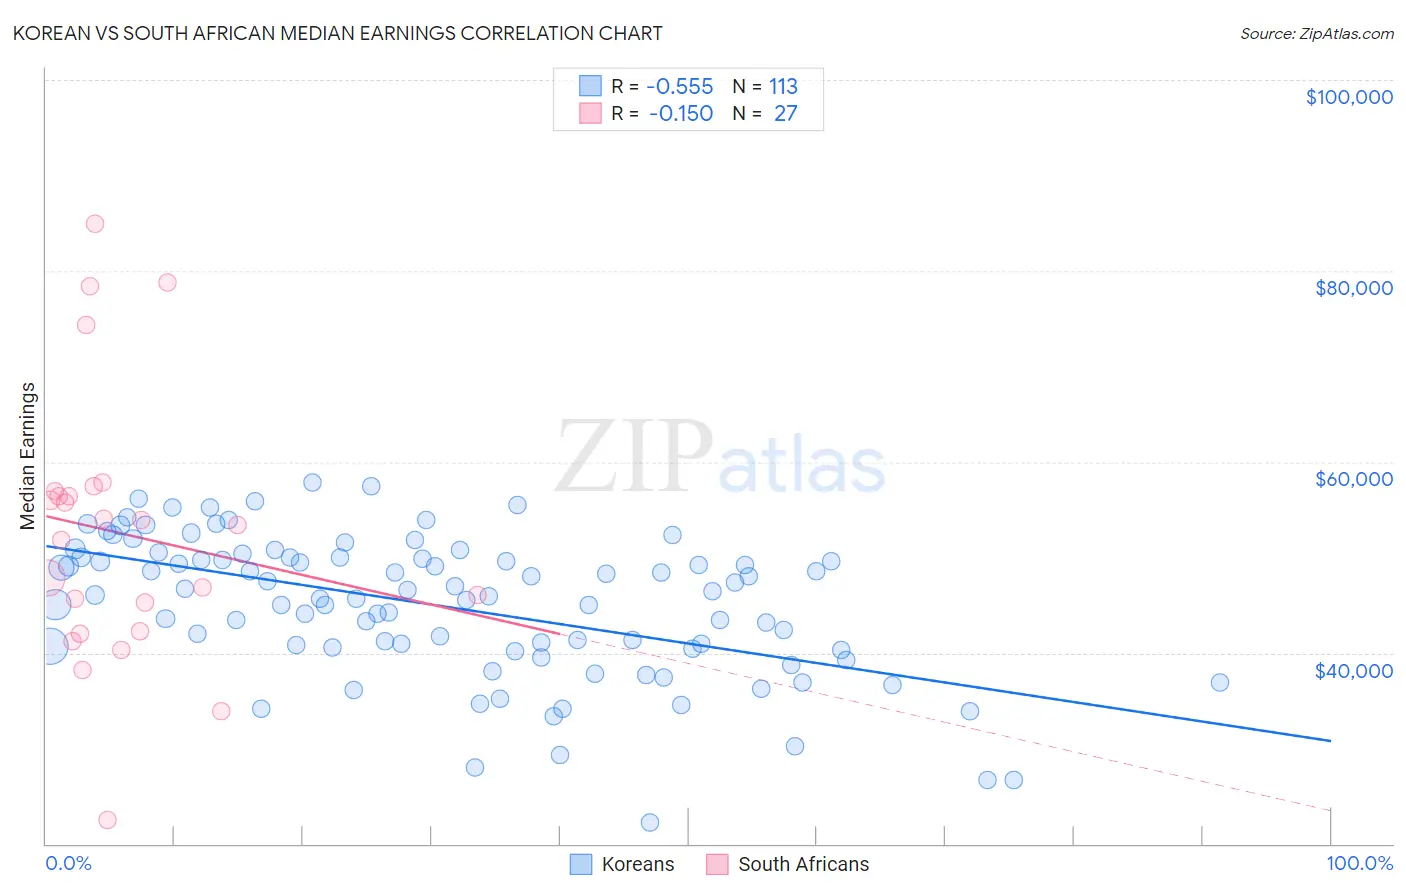
Korean vs South African Median Earnings Correlation Chart
The statistical analysis conducted on geographies consisting of 510,900,863 people shows a substantial negative correlation between the proportion of Koreans and median earnings in the United States with a correlation coefficient (R) of -0.555 and weighted average of $48,727. Similarly, the statistical analysis conducted on geographies consisting of 182,600,845 people shows a poor negative correlation between the proportion of South Africans and median earnings in the United States with a correlation coefficient (R) of -0.150 and weighted average of $50,752, a difference of 4.2%.
Median Earnings Correlation Summary
| Measurement | Korean | South African |
| Minimum | $22,216 | $22,500 |
| Maximum | $57,875 | $84,919 |
| Range | $35,659 | $62,419 |
| Mean | $44,924 | $52,531 |
| Median | $46,110 | $53,417 |
| Interquartile 25% (IQ1) | $40,528 | $42,247 |
| Interquartile 75% (IQ3) | $49,935 | $56,939 |
| Interquartile Range (IQR) | $9,407 | $14,692 |
| Standard Deviation (Sample) | $7,353 | $14,077 |
| Standard Deviation (Population) | $7,320 | $13,814 |
Similar Demographics by Median Earnings
Demographics Similar to Koreans by Median Earnings
In terms of median earnings, the demographic groups most similar to Koreans are Serbian ($48,677, a difference of 0.10%), Immigrants from Jordan ($48,673, a difference of 0.11%), Polish ($48,659, a difference of 0.14%), Chinese ($48,836, a difference of 0.22%), and Moroccan ($48,838, a difference of 0.23%).
| Demographics | Rating | Rank | Median Earnings |
| Syrians | 97.1 /100 | #109 | Exceptional $48,934 |
| Immigrants | Ethiopia | 97.1 /100 | #110 | Exceptional $48,924 |
| Immigrants | Zimbabwe | 97.0 /100 | #111 | Exceptional $48,913 |
| Northern Europeans | 96.9 /100 | #112 | Exceptional $48,887 |
| Immigrants | Kuwait | 96.8 /100 | #113 | Exceptional $48,861 |
| Moroccans | 96.7 /100 | #114 | Exceptional $48,838 |
| Chinese | 96.7 /100 | #115 | Exceptional $48,836 |
| Koreans | 96.2 /100 | #116 | Exceptional $48,727 |
| Serbians | 95.9 /100 | #117 | Exceptional $48,677 |
| Immigrants | Jordan | 95.9 /100 | #118 | Exceptional $48,673 |
| Poles | 95.8 /100 | #119 | Exceptional $48,659 |
| Carpatho Rusyns | 95.5 /100 | #120 | Exceptional $48,617 |
| Arabs | 95.4 /100 | #121 | Exceptional $48,599 |
| Chileans | 94.8 /100 | #122 | Exceptional $48,504 |
| Immigrants | Syria | 93.9 /100 | #123 | Exceptional $48,375 |
Demographics Similar to South Africans by Median Earnings
In terms of median earnings, the demographic groups most similar to South Africans are Immigrants from Scotland ($50,741, a difference of 0.020%), Immigrants from Netherlands ($50,818, a difference of 0.13%), Immigrants from Egypt ($50,901, a difference of 0.29%), Immigrants from Italy ($50,581, a difference of 0.34%), and Immigrants from Western Europe ($50,549, a difference of 0.40%).
| Demographics | Rating | Rank | Median Earnings |
| Immigrants | Spain | 99.9 /100 | #67 | Exceptional $51,092 |
| Paraguayans | 99.9 /100 | #68 | Exceptional $51,068 |
| Mongolians | 99.8 /100 | #69 | Exceptional $51,038 |
| Lithuanians | 99.8 /100 | #70 | Exceptional $50,991 |
| Immigrants | Ukraine | 99.8 /100 | #71 | Exceptional $50,984 |
| Immigrants | Egypt | 99.8 /100 | #72 | Exceptional $50,901 |
| Immigrants | Netherlands | 99.8 /100 | #73 | Exceptional $50,818 |
| South Africans | 99.8 /100 | #74 | Exceptional $50,752 |
| Immigrants | Scotland | 99.8 /100 | #75 | Exceptional $50,741 |
| Immigrants | Italy | 99.7 /100 | #76 | Exceptional $50,581 |
| Immigrants | Western Europe | 99.7 /100 | #77 | Exceptional $50,549 |
| Argentineans | 99.6 /100 | #78 | Exceptional $50,399 |
| Laotians | 99.6 /100 | #79 | Exceptional $50,343 |
| Ukrainians | 99.6 /100 | #80 | Exceptional $50,320 |
| Immigrants | Southern Europe | 99.6 /100 | #81 | Exceptional $50,280 |