Korean vs Latvian Householder Income Under 25 years
COMPARE
Korean
Latvian
Householder Income Under 25 years
Householder Income Under 25 years Comparison
Koreans
Latvians
$57,730
HOUSEHOLDER INCOME UNDER 25 YEARS
100.0/ 100
METRIC RATING
15th/ 347
METRIC RANK
$52,783
HOUSEHOLDER INCOME UNDER 25 YEARS
81.0/ 100
METRIC RATING
147th/ 347
METRIC RANK
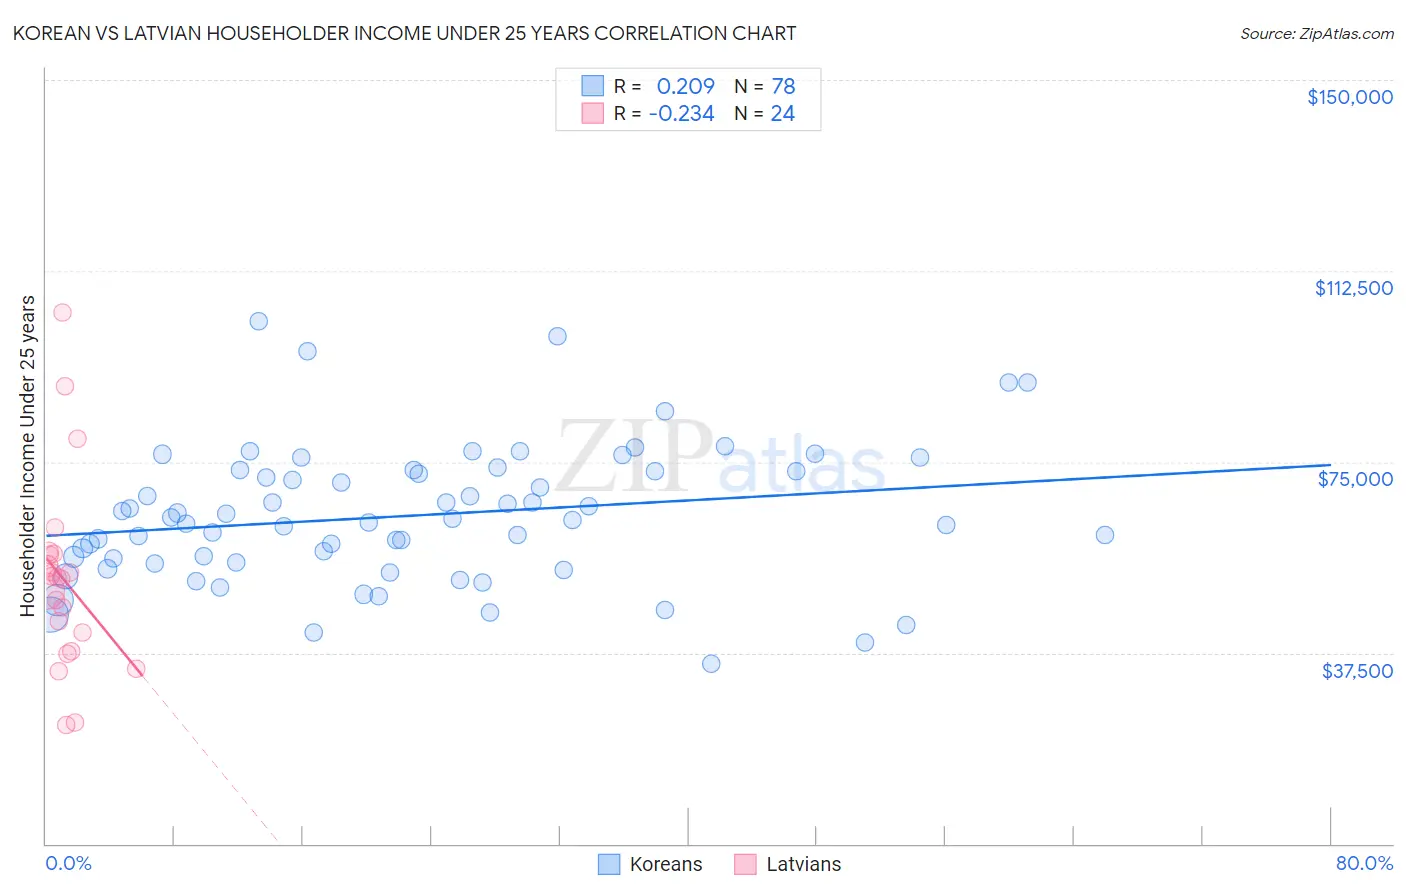
Korean vs Latvian Householder Income Under 25 years Correlation Chart
The statistical analysis conducted on geographies consisting of 413,031,760 people shows a weak positive correlation between the proportion of Koreans and household income with householder under the age of 25 in the United States with a correlation coefficient (R) of 0.209 and weighted average of $57,730. Similarly, the statistical analysis conducted on geographies consisting of 192,099,728 people shows a weak negative correlation between the proportion of Latvians and household income with householder under the age of 25 in the United States with a correlation coefficient (R) of -0.234 and weighted average of $52,783, a difference of 9.4%.
Householder Income Under 25 years Correlation Summary
| Measurement | Korean | Latvian |
| Minimum | $35,240 | $23,229 |
| Maximum | $102,679 | $104,283 |
| Range | $67,439 | $81,054 |
| Mean | $64,423 | $51,847 |
| Median | $63,619 | $52,213 |
| Interquartile 25% (IQ1) | $55,260 | $39,684 |
| Interquartile 75% (IQ3) | $73,277 | $56,857 |
| Interquartile Range (IQR) | $18,017 | $17,174 |
| Standard Deviation (Sample) | $13,448 | $18,675 |
| Standard Deviation (Population) | $13,362 | $18,282 |
Similar Demographics by Householder Income Under 25 years
Demographics Similar to Koreans by Householder Income Under 25 years
In terms of householder income under 25 years, the demographic groups most similar to Koreans are Filipino ($57,740, a difference of 0.020%), Immigrants from South Central Asia ($57,818, a difference of 0.15%), Immigrants from China ($57,931, a difference of 0.35%), Immigrants from Philippines ($57,930, a difference of 0.35%), and Immigrants from Afghanistan ($57,478, a difference of 0.44%).
| Demographics | Rating | Rank | Householder Income Under 25 years |
| Indians (Asian) | 100.0 /100 | #8 | Exceptional $58,239 |
| Chinese | 100.0 /100 | #9 | Exceptional $58,162 |
| Afghans | 100.0 /100 | #10 | Exceptional $58,019 |
| Immigrants | China | 100.0 /100 | #11 | Exceptional $57,931 |
| Immigrants | Philippines | 100.0 /100 | #12 | Exceptional $57,930 |
| Immigrants | South Central Asia | 100.0 /100 | #13 | Exceptional $57,818 |
| Filipinos | 100.0 /100 | #14 | Exceptional $57,740 |
| Koreans | 100.0 /100 | #15 | Exceptional $57,730 |
| Immigrants | Afghanistan | 100.0 /100 | #16 | Exceptional $57,478 |
| Sierra Leoneans | 100.0 /100 | #17 | Exceptional $57,272 |
| Immigrants | Eastern Asia | 100.0 /100 | #18 | Exceptional $57,123 |
| Bhutanese | 100.0 /100 | #19 | Exceptional $57,078 |
| Immigrants | Ireland | 100.0 /100 | #20 | Exceptional $57,075 |
| Immigrants | Fiji | 100.0 /100 | #21 | Exceptional $57,074 |
| Asians | 100.0 /100 | #22 | Exceptional $57,003 |
Demographics Similar to Latvians by Householder Income Under 25 years
In terms of householder income under 25 years, the demographic groups most similar to Latvians are Immigrants from Hungary ($52,798, a difference of 0.030%), French Canadian ($52,672, a difference of 0.21%), Scandinavian ($52,654, a difference of 0.24%), Immigrants from Costa Rica ($52,643, a difference of 0.27%), and Immigrants from Scotland ($52,638, a difference of 0.28%).
| Demographics | Rating | Rank | Householder Income Under 25 years |
| Hawaiians | 89.8 /100 | #140 | Excellent $53,078 |
| Danes | 88.9 /100 | #141 | Excellent $53,041 |
| Immigrants | Armenia | 87.5 /100 | #142 | Excellent $52,986 |
| Swedes | 87.5 /100 | #143 | Excellent $52,986 |
| South American Indians | 87.3 /100 | #144 | Excellent $52,979 |
| Immigrants | Western Europe | 86.7 /100 | #145 | Excellent $52,957 |
| Immigrants | Hungary | 81.6 /100 | #146 | Excellent $52,798 |
| Latvians | 81.0 /100 | #147 | Excellent $52,783 |
| French Canadians | 76.5 /100 | #148 | Good $52,672 |
| Scandinavians | 75.7 /100 | #149 | Good $52,654 |
| Immigrants | Costa Rica | 75.2 /100 | #150 | Good $52,643 |
| Immigrants | Scotland | 75.0 /100 | #151 | Good $52,638 |
| Trinidadians and Tobagonians | 74.6 /100 | #152 | Good $52,631 |
| Central Americans | 74.4 /100 | #153 | Good $52,626 |
| Immigrants | Azores | 74.2 /100 | #154 | Good $52,621 |