Kiowa vs Uruguayan Median Earnings
COMPARE
Kiowa
Uruguayan
Median Earnings
Median Earnings Comparison
Kiowa
Uruguayans
$39,232
MEDIAN EARNINGS
0.0/ 100
METRIC RATING
329th/ 347
METRIC RANK
$46,190
MEDIAN EARNINGS
41.6/ 100
METRIC RATING
185th/ 347
METRIC RANK
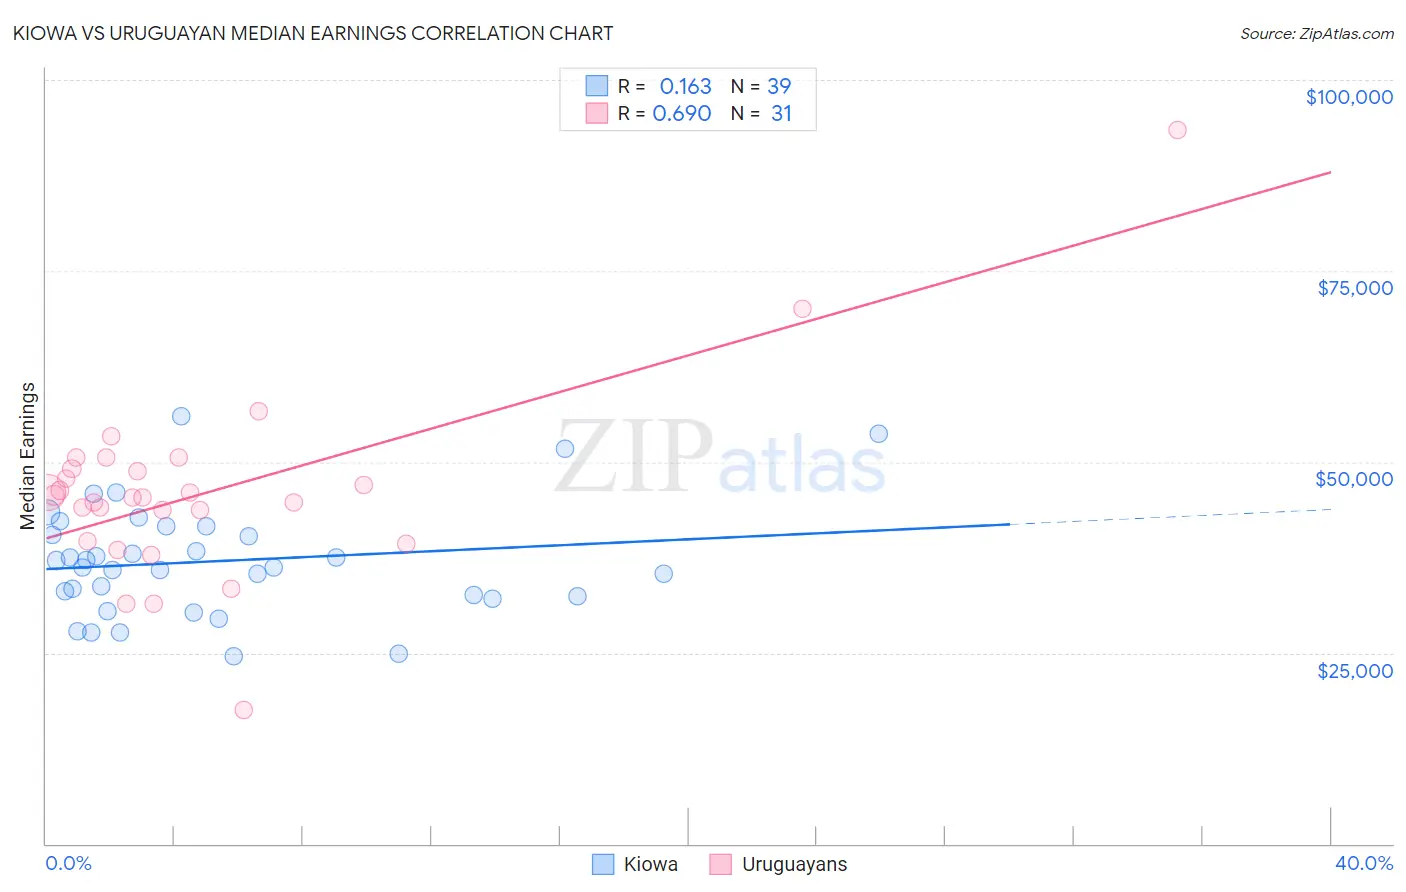
Kiowa vs Uruguayan Median Earnings Correlation Chart
The statistical analysis conducted on geographies consisting of 56,100,586 people shows a poor positive correlation between the proportion of Kiowa and median earnings in the United States with a correlation coefficient (R) of 0.163 and weighted average of $39,232. Similarly, the statistical analysis conducted on geographies consisting of 144,784,894 people shows a significant positive correlation between the proportion of Uruguayans and median earnings in the United States with a correlation coefficient (R) of 0.690 and weighted average of $46,190, a difference of 17.7%.
Median Earnings Correlation Summary
| Measurement | Kiowa | Uruguayan |
| Minimum | $24,615 | $17,500 |
| Maximum | $55,938 | $93,387 |
| Range | $31,323 | $75,887 |
| Mean | $37,003 | $45,994 |
| Median | $36,193 | $45,417 |
| Interquartile 25% (IQ1) | $32,335 | $39,561 |
| Interquartile 75% (IQ3) | $41,599 | $49,175 |
| Interquartile Range (IQR) | $9,264 | $9,613 |
| Standard Deviation (Sample) | $7,253 | $12,526 |
| Standard Deviation (Population) | $7,159 | $12,322 |
Similar Demographics by Median Earnings
Demographics Similar to Kiowa by Median Earnings
In terms of median earnings, the demographic groups most similar to Kiowa are Immigrants from Congo ($39,169, a difference of 0.16%), Immigrants from Mexico ($39,114, a difference of 0.30%), Yakama ($39,107, a difference of 0.32%), Sioux ($39,448, a difference of 0.55%), and Houma ($38,949, a difference of 0.73%).
| Demographics | Rating | Rank | Median Earnings |
| Immigrants | Central America | 0.0 /100 | #322 | Tragic $39,762 |
| Bahamians | 0.0 /100 | #323 | Tragic $39,735 |
| Ottawa | 0.0 /100 | #324 | Tragic $39,721 |
| Creek | 0.0 /100 | #325 | Tragic $39,648 |
| Immigrants | Yemen | 0.0 /100 | #326 | Tragic $39,540 |
| Yuman | 0.0 /100 | #327 | Tragic $39,523 |
| Sioux | 0.0 /100 | #328 | Tragic $39,448 |
| Kiowa | 0.0 /100 | #329 | Tragic $39,232 |
| Immigrants | Congo | 0.0 /100 | #330 | Tragic $39,169 |
| Immigrants | Mexico | 0.0 /100 | #331 | Tragic $39,114 |
| Yakama | 0.0 /100 | #332 | Tragic $39,107 |
| Houma | 0.0 /100 | #333 | Tragic $38,949 |
| Spanish American Indians | 0.0 /100 | #334 | Tragic $38,907 |
| Natives/Alaskans | 0.0 /100 | #335 | Tragic $38,896 |
| Crow | 0.0 /100 | #336 | Tragic $38,707 |
Demographics Similar to Uruguayans by Median Earnings
In terms of median earnings, the demographic groups most similar to Uruguayans are Vietnamese ($46,172, a difference of 0.040%), Immigrants from Kenya ($46,214, a difference of 0.050%), Iraqi ($46,140, a difference of 0.11%), Immigrants from Armenia ($46,094, a difference of 0.21%), and French ($46,296, a difference of 0.23%).
| Demographics | Rating | Rank | Median Earnings |
| Colombians | 47.1 /100 | #178 | Average $46,349 |
| English | 46.5 /100 | #179 | Average $46,334 |
| Puget Sound Salish | 46.5 /100 | #180 | Average $46,333 |
| Immigrants | Cameroon | 46.4 /100 | #181 | Average $46,329 |
| Swiss | 45.9 /100 | #182 | Average $46,315 |
| French | 45.2 /100 | #183 | Average $46,296 |
| Immigrants | Kenya | 42.4 /100 | #184 | Average $46,214 |
| Uruguayans | 41.6 /100 | #185 | Average $46,190 |
| Vietnamese | 40.9 /100 | #186 | Average $46,172 |
| Iraqis | 39.9 /100 | #187 | Fair $46,140 |
| Immigrants | Armenia | 38.3 /100 | #188 | Fair $46,094 |
| Spaniards | 37.2 /100 | #189 | Fair $46,059 |
| French Canadians | 36.1 /100 | #190 | Fair $46,026 |
| Finns | 33.4 /100 | #191 | Fair $45,940 |
| Germans | 33.2 /100 | #192 | Fair $45,935 |