Kiowa vs Immigrants from Oceania Median Household Income
COMPARE
Kiowa
Immigrants from Oceania
Median Household Income
Median Household Income Comparison
Kiowa
Immigrants from Oceania
$65,914
MEDIAN HOUSEHOLD INCOME
0.0/ 100
METRIC RATING
337th/ 347
METRIC RANK
$89,100
MEDIAN HOUSEHOLD INCOME
92.9/ 100
METRIC RATING
126th/ 347
METRIC RANK
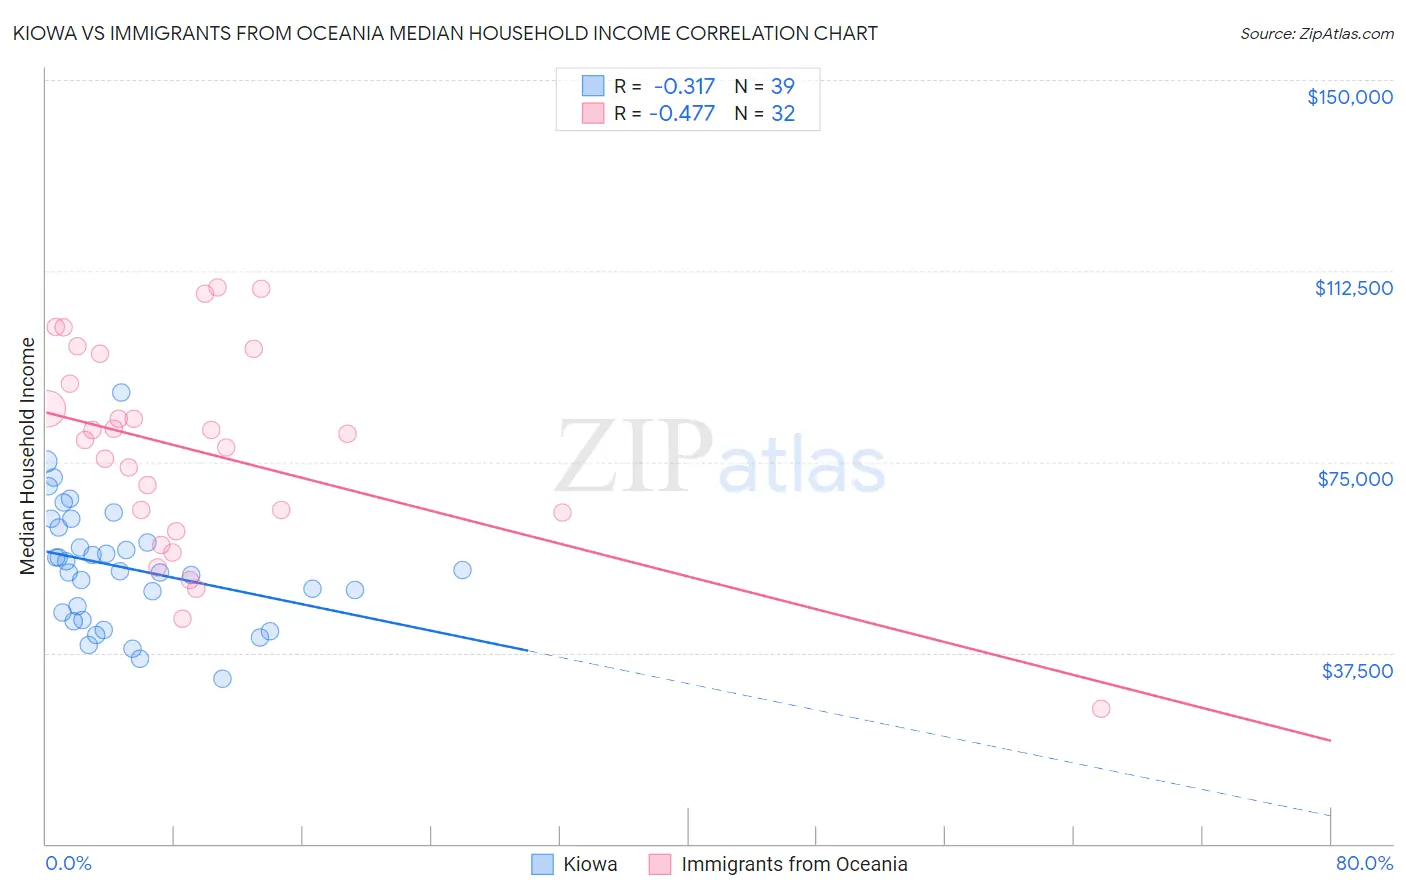
Kiowa vs Immigrants from Oceania Median Household Income Correlation Chart
The statistical analysis conducted on geographies consisting of 56,098,760 people shows a mild negative correlation between the proportion of Kiowa and median household income in the United States with a correlation coefficient (R) of -0.317 and weighted average of $65,914. Similarly, the statistical analysis conducted on geographies consisting of 305,340,910 people shows a moderate negative correlation between the proportion of Immigrants from Oceania and median household income in the United States with a correlation coefficient (R) of -0.477 and weighted average of $89,100, a difference of 35.2%.
Median Household Income Correlation Summary
| Measurement | Kiowa | Immigrants from Oceania |
| Minimum | $32,500 | $26,558 |
| Maximum | $88,558 | $109,241 |
| Range | $56,058 | $82,683 |
| Mean | $54,131 | $77,019 |
| Median | $53,438 | $80,011 |
| Interquartile 25% (IQ1) | $43,977 | $63,155 |
| Interquartile 75% (IQ3) | $62,181 | $93,329 |
| Interquartile Range (IQR) | $18,204 | $30,174 |
| Standard Deviation (Sample) | $11,836 | $20,295 |
| Standard Deviation (Population) | $11,684 | $19,975 |
Similar Demographics by Median Household Income
Demographics Similar to Kiowa by Median Household Income
In terms of median household income, the demographic groups most similar to Kiowa are Immigrants from Yemen ($65,194, a difference of 1.1%), Immigrants from Congo ($66,768, a difference of 1.3%), Hopi ($65,043, a difference of 1.3%), Cheyenne ($66,974, a difference of 1.6%), and Pueblo ($64,692, a difference of 1.9%).
| Demographics | Rating | Rank | Median Household Income |
| Arapaho | 0.0 /100 | #330 | Tragic $67,965 |
| Natives/Alaskans | 0.0 /100 | #331 | Tragic $67,879 |
| Sioux | 0.0 /100 | #332 | Tragic $67,792 |
| Creek | 0.0 /100 | #333 | Tragic $67,715 |
| Blacks/African Americans | 0.0 /100 | #334 | Tragic $67,573 |
| Cheyenne | 0.0 /100 | #335 | Tragic $66,974 |
| Immigrants | Congo | 0.0 /100 | #336 | Tragic $66,768 |
| Kiowa | 0.0 /100 | #337 | Tragic $65,914 |
| Immigrants | Yemen | 0.0 /100 | #338 | Tragic $65,194 |
| Hopi | 0.0 /100 | #339 | Tragic $65,043 |
| Pueblo | 0.0 /100 | #340 | Tragic $64,692 |
| Crow | 0.0 /100 | #341 | Tragic $63,681 |
| Pima | 0.0 /100 | #342 | Tragic $63,262 |
| Houma | 0.0 /100 | #343 | Tragic $62,575 |
| Tohono O'odham | 0.0 /100 | #344 | Tragic $61,663 |
Demographics Similar to Immigrants from Oceania by Median Household Income
In terms of median household income, the demographic groups most similar to Immigrants from Oceania are Immigrants from Peru ($89,010, a difference of 0.10%), Portuguese ($88,976, a difference of 0.14%), Immigrants from Kuwait ($89,263, a difference of 0.18%), Brazilian ($88,934, a difference of 0.19%), and British ($88,914, a difference of 0.21%).
| Demographics | Rating | Rank | Median Household Income |
| Albanians | 95.2 /100 | #119 | Exceptional $89,744 |
| Immigrants | North Macedonia | 95.2 /100 | #120 | Exceptional $89,741 |
| Ethiopians | 94.9 /100 | #121 | Exceptional $89,640 |
| Pakistanis | 94.8 /100 | #122 | Exceptional $89,638 |
| Immigrants | Zimbabwe | 94.4 /100 | #123 | Exceptional $89,496 |
| Immigrants | Jordan | 94.1 /100 | #124 | Exceptional $89,412 |
| Immigrants | Kuwait | 93.5 /100 | #125 | Exceptional $89,263 |
| Immigrants | Oceania | 92.9 /100 | #126 | Exceptional $89,100 |
| Immigrants | Peru | 92.5 /100 | #127 | Exceptional $89,010 |
| Portuguese | 92.3 /100 | #128 | Exceptional $88,976 |
| Brazilians | 92.1 /100 | #129 | Exceptional $88,934 |
| British | 92.0 /100 | #130 | Exceptional $88,914 |
| Immigrants | Syria | 91.4 /100 | #131 | Exceptional $88,792 |
| Europeans | 91.2 /100 | #132 | Exceptional $88,751 |
| Immigrants | Ethiopia | 90.9 /100 | #133 | Exceptional $88,687 |