Kiowa vs Egyptian Median Female Earnings
COMPARE
Kiowa
Egyptian
Median Female Earnings
Median Female Earnings Comparison
Kiowa
Egyptians
$34,074
MEDIAN FEMALE EARNINGS
0.0/ 100
METRIC RATING
326th/ 347
METRIC RANK
$43,305
MEDIAN FEMALE EARNINGS
99.9/ 100
METRIC RATING
55th/ 347
METRIC RANK
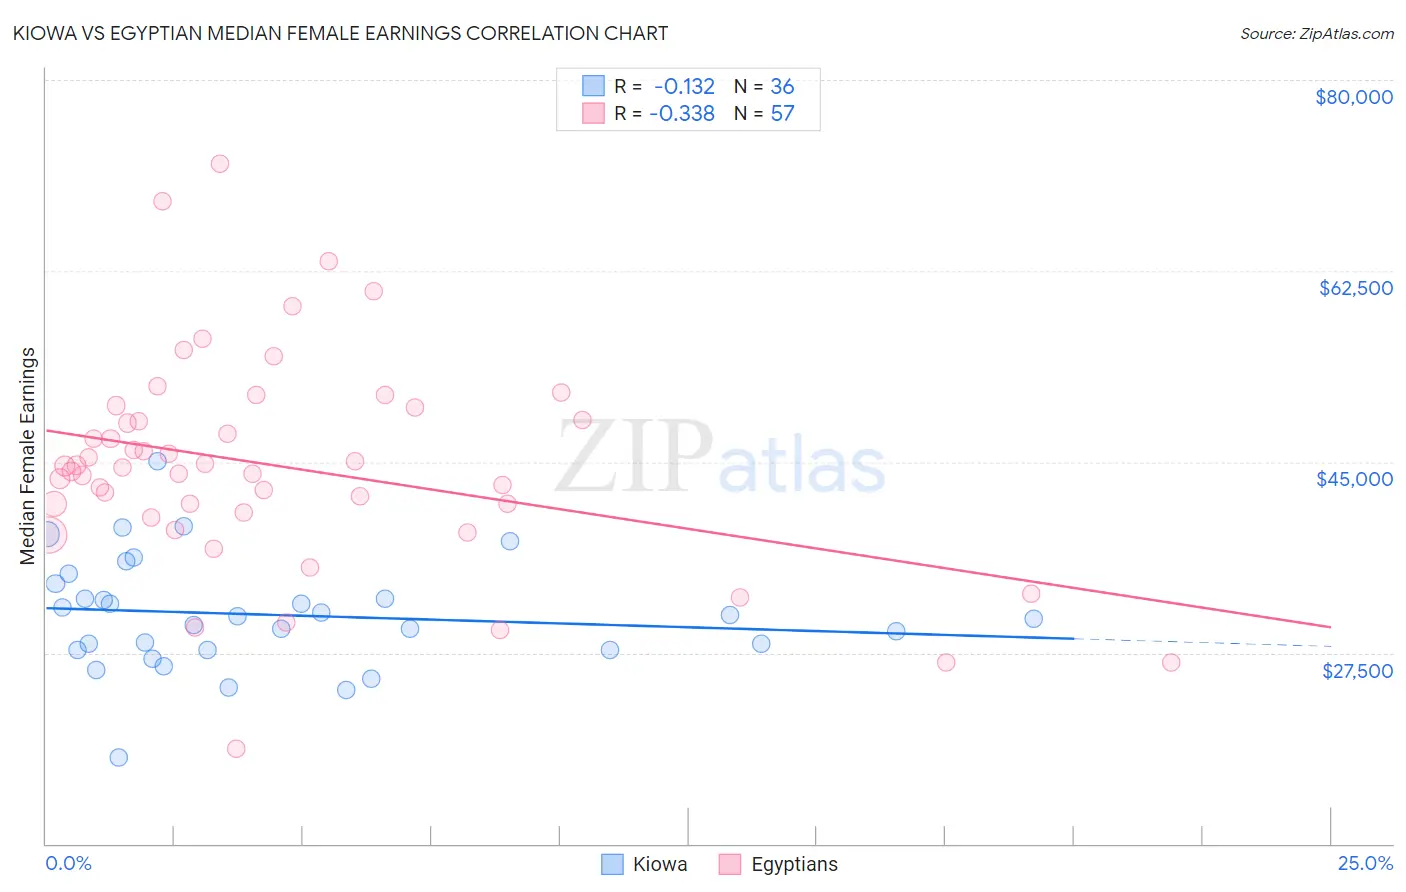
Kiowa vs Egyptian Median Female Earnings Correlation Chart
The statistical analysis conducted on geographies consisting of 56,093,569 people shows a poor negative correlation between the proportion of Kiowa and median female earnings in the United States with a correlation coefficient (R) of -0.132 and weighted average of $34,074. Similarly, the statistical analysis conducted on geographies consisting of 276,887,423 people shows a mild negative correlation between the proportion of Egyptians and median female earnings in the United States with a correlation coefficient (R) of -0.338 and weighted average of $43,305, a difference of 27.1%.
Median Female Earnings Correlation Summary
| Measurement | Kiowa | Egyptian |
| Minimum | $17,933 | $18,750 |
| Maximum | $45,071 | $72,362 |
| Range | $27,137 | $53,612 |
| Mean | $30,965 | $44,581 |
| Median | $30,714 | $44,449 |
| Interquartile 25% (IQ1) | $27,790 | $40,134 |
| Interquartile 75% (IQ3) | $33,181 | $49,358 |
| Interquartile Range (IQR) | $5,391 | $9,224 |
| Standard Deviation (Sample) | $5,151 | $9,878 |
| Standard Deviation (Population) | $5,079 | $9,791 |
Similar Demographics by Median Female Earnings
Demographics Similar to Kiowa by Median Female Earnings
In terms of median female earnings, the demographic groups most similar to Kiowa are Dutch West Indian ($34,106, a difference of 0.090%), Cajun ($34,034, a difference of 0.12%), Immigrants from Central America ($33,953, a difference of 0.36%), Hopi ($33,932, a difference of 0.42%), and Menominee ($33,894, a difference of 0.53%).
| Demographics | Rating | Rank | Median Female Earnings |
| Shoshone | 0.0 /100 | #319 | Tragic $34,677 |
| Immigrants | Honduras | 0.0 /100 | #320 | Tragic $34,647 |
| Hispanics or Latinos | 0.0 /100 | #321 | Tragic $34,421 |
| Chickasaw | 0.0 /100 | #322 | Tragic $34,414 |
| Seminole | 0.0 /100 | #323 | Tragic $34,385 |
| Immigrants | Congo | 0.0 /100 | #324 | Tragic $34,317 |
| Dutch West Indians | 0.0 /100 | #325 | Tragic $34,106 |
| Kiowa | 0.0 /100 | #326 | Tragic $34,074 |
| Cajuns | 0.0 /100 | #327 | Tragic $34,034 |
| Immigrants | Central America | 0.0 /100 | #328 | Tragic $33,953 |
| Hopi | 0.0 /100 | #329 | Tragic $33,932 |
| Menominee | 0.0 /100 | #330 | Tragic $33,894 |
| Natives/Alaskans | 0.0 /100 | #331 | Tragic $33,806 |
| Choctaw | 0.0 /100 | #332 | Tragic $33,775 |
| Mexicans | 0.0 /100 | #333 | Tragic $33,664 |
Demographics Similar to Egyptians by Median Female Earnings
In terms of median female earnings, the demographic groups most similar to Egyptians are Immigrants from Eastern Europe ($43,309, a difference of 0.010%), Australian ($43,308, a difference of 0.010%), Immigrants from Lithuania ($43,317, a difference of 0.030%), Immigrants from Croatia ($43,258, a difference of 0.11%), and Maltese ($43,357, a difference of 0.12%).
| Demographics | Rating | Rank | Median Female Earnings |
| Immigrants | Indonesia | 100.0 /100 | #48 | Exceptional $43,412 |
| Immigrants | Serbia | 100.0 /100 | #49 | Exceptional $43,385 |
| Immigrants | Uzbekistan | 100.0 /100 | #50 | Exceptional $43,363 |
| Maltese | 100.0 /100 | #51 | Exceptional $43,357 |
| Immigrants | Lithuania | 99.9 /100 | #52 | Exceptional $43,317 |
| Immigrants | Eastern Europe | 99.9 /100 | #53 | Exceptional $43,309 |
| Australians | 99.9 /100 | #54 | Exceptional $43,308 |
| Egyptians | 99.9 /100 | #55 | Exceptional $43,305 |
| Immigrants | Croatia | 99.9 /100 | #56 | Exceptional $43,258 |
| Ethiopians | 99.9 /100 | #57 | Exceptional $43,243 |
| Paraguayans | 99.9 /100 | #58 | Exceptional $43,173 |
| Estonians | 99.9 /100 | #59 | Exceptional $43,106 |
| Immigrants | Latvia | 99.9 /100 | #60 | Exceptional $43,099 |
| Immigrants | Bulgaria | 99.9 /100 | #61 | Exceptional $43,085 |
| Afghans | 99.9 /100 | #62 | Exceptional $43,077 |