Kenyan vs Greek Median Earnings
COMPARE
Kenyan
Greek
Median Earnings
Median Earnings Comparison
Kenyans
Greeks
$46,462
MEDIAN EARNINGS
51.0/ 100
METRIC RATING
172nd/ 347
METRIC RANK
$51,164
MEDIAN EARNINGS
99.9/ 100
METRIC RATING
65th/ 347
METRIC RANK
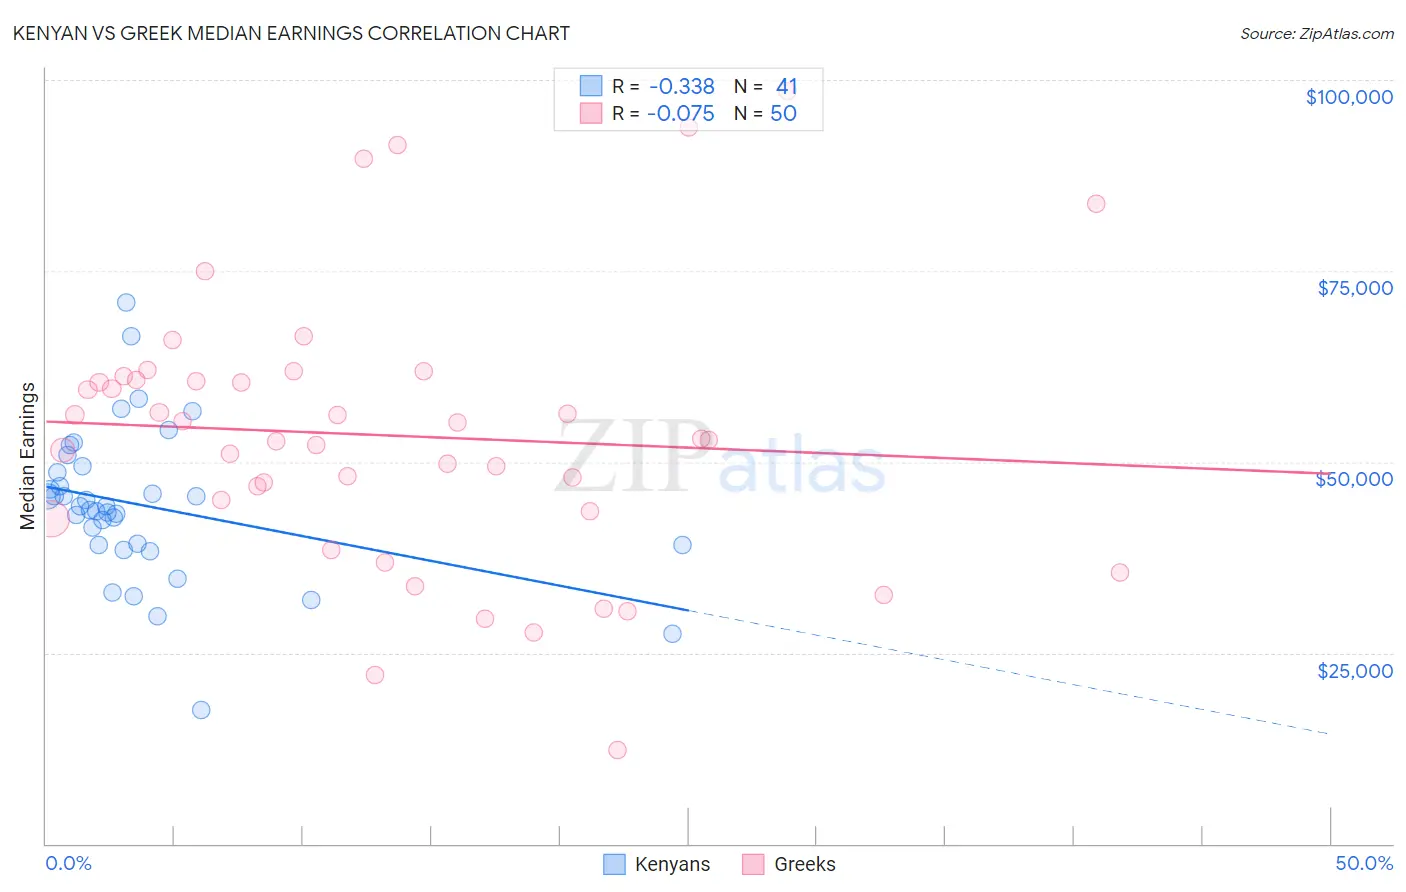
Kenyan vs Greek Median Earnings Correlation Chart
The statistical analysis conducted on geographies consisting of 168,231,616 people shows a mild negative correlation between the proportion of Kenyans and median earnings in the United States with a correlation coefficient (R) of -0.338 and weighted average of $46,462. Similarly, the statistical analysis conducted on geographies consisting of 482,719,843 people shows a slight negative correlation between the proportion of Greeks and median earnings in the United States with a correlation coefficient (R) of -0.075 and weighted average of $51,164, a difference of 10.1%.
Median Earnings Correlation Summary
| Measurement | Kenyan | Greek |
| Minimum | $17,500 | $12,321 |
| Maximum | $70,848 | $98,462 |
| Range | $53,348 | $86,141 |
| Mean | $44,292 | $53,439 |
| Median | $44,246 | $52,981 |
| Interquartile 25% (IQ1) | $39,165 | $43,544 |
| Interquartile 75% (IQ3) | $49,031 | $60,703 |
| Interquartile Range (IQR) | $9,866 | $17,159 |
| Standard Deviation (Sample) | $9,917 | $17,942 |
| Standard Deviation (Population) | $9,795 | $17,762 |
Similar Demographics by Median Earnings
Demographics Similar to Kenyans by Median Earnings
In terms of median earnings, the demographic groups most similar to Kenyans are Scottish ($46,463, a difference of 0.0%), Immigrants ($46,478, a difference of 0.030%), Ghanaian ($46,440, a difference of 0.050%), Scandinavian ($46,433, a difference of 0.060%), and Basque ($46,399, a difference of 0.14%).
| Demographics | Rating | Rank | Median Earnings |
| South Americans | 62.7 /100 | #165 | Good $46,804 |
| Czechoslovakians | 57.8 /100 | #166 | Average $46,658 |
| Costa Ricans | 57.4 /100 | #167 | Average $46,645 |
| Immigrants | Africa | 54.6 /100 | #168 | Average $46,564 |
| Immigrants | South America | 54.0 /100 | #169 | Average $46,548 |
| Immigrants | Immigrants | 51.6 /100 | #170 | Average $46,478 |
| Scottish | 51.1 /100 | #171 | Average $46,463 |
| Kenyans | 51.0 /100 | #172 | Average $46,462 |
| Ghanaians | 50.3 /100 | #173 | Average $46,440 |
| Scandinavians | 50.0 /100 | #174 | Average $46,433 |
| Basques | 48.8 /100 | #175 | Average $46,399 |
| Danes | 48.6 /100 | #176 | Average $46,392 |
| Belgians | 48.0 /100 | #177 | Average $46,375 |
| Colombians | 47.1 /100 | #178 | Average $46,349 |
| English | 46.5 /100 | #179 | Average $46,334 |
Demographics Similar to Greeks by Median Earnings
In terms of median earnings, the demographic groups most similar to Greeks are Afghan ($51,112, a difference of 0.10%), Immigrants from Spain ($51,092, a difference of 0.14%), New Zealander ($51,246, a difference of 0.16%), Paraguayan ($51,068, a difference of 0.19%), and Mongolian ($51,038, a difference of 0.25%).
| Demographics | Rating | Rank | Median Earnings |
| Immigrants | Bolivia | 99.9 /100 | #58 | Exceptional $51,605 |
| Immigrants | Croatia | 99.9 /100 | #59 | Exceptional $51,581 |
| Immigrants | Serbia | 99.9 /100 | #60 | Exceptional $51,557 |
| Immigrants | Latvia | 99.9 /100 | #61 | Exceptional $51,555 |
| Immigrants | Romania | 99.9 /100 | #62 | Exceptional $51,337 |
| Immigrants | Bulgaria | 99.9 /100 | #63 | Exceptional $51,318 |
| New Zealanders | 99.9 /100 | #64 | Exceptional $51,246 |
| Greeks | 99.9 /100 | #65 | Exceptional $51,164 |
| Afghans | 99.9 /100 | #66 | Exceptional $51,112 |
| Immigrants | Spain | 99.9 /100 | #67 | Exceptional $51,092 |
| Paraguayans | 99.9 /100 | #68 | Exceptional $51,068 |
| Mongolians | 99.8 /100 | #69 | Exceptional $51,038 |
| Lithuanians | 99.8 /100 | #70 | Exceptional $50,991 |
| Immigrants | Ukraine | 99.8 /100 | #71 | Exceptional $50,984 |
| Immigrants | Egypt | 99.8 /100 | #72 | Exceptional $50,901 |