Jordanian vs Moroccan Householder Income Ages 25 - 44 years
COMPARE
Jordanian
Moroccan
Householder Income Ages 25 - 44 years
Householder Income Ages 25 - 44 years Comparison
Jordanians
Moroccans
$99,186
HOUSEHOLDER INCOME AGES 25 - 44 YEARS
92.8/ 100
METRIC RATING
119th/ 347
METRIC RANK
$96,117
HOUSEHOLDER INCOME AGES 25 - 44 YEARS
70.3/ 100
METRIC RATING
155th/ 347
METRIC RANK
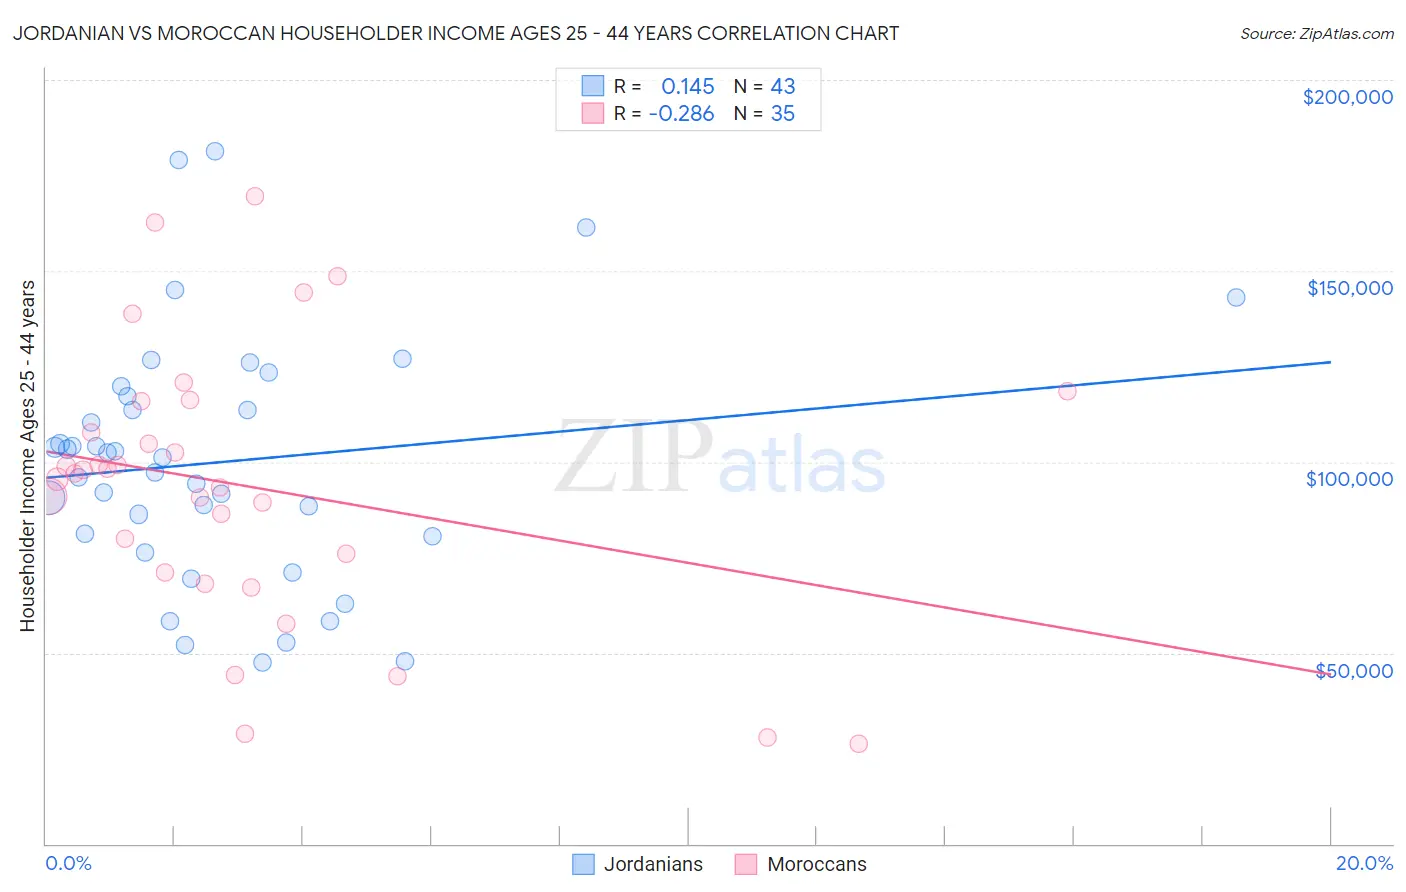
Jordanian vs Moroccan Householder Income Ages 25 - 44 years Correlation Chart
The statistical analysis conducted on geographies consisting of 166,327,979 people shows a poor positive correlation between the proportion of Jordanians and household income with householder between the ages 25 and 44 in the United States with a correlation coefficient (R) of 0.145 and weighted average of $99,186. Similarly, the statistical analysis conducted on geographies consisting of 201,535,372 people shows a weak negative correlation between the proportion of Moroccans and household income with householder between the ages 25 and 44 in the United States with a correlation coefficient (R) of -0.286 and weighted average of $96,117, a difference of 3.2%.
Householder Income Ages 25 - 44 years Correlation Summary
| Measurement | Jordanian | Moroccan |
| Minimum | $47,305 | $26,250 |
| Maximum | $181,494 | $169,563 |
| Range | $134,189 | $143,313 |
| Mean | $99,931 | $93,636 |
| Median | $101,206 | $96,963 |
| Interquartile 25% (IQ1) | $80,556 | $70,962 |
| Interquartile 75% (IQ3) | $117,253 | $115,732 |
| Interquartile Range (IQR) | $36,697 | $44,770 |
| Standard Deviation (Sample) | $32,051 | $35,487 |
| Standard Deviation (Population) | $31,676 | $34,976 |
Similar Demographics by Householder Income Ages 25 - 44 years
Demographics Similar to Jordanians by Householder Income Ages 25 - 44 years
In terms of householder income ages 25 - 44 years, the demographic groups most similar to Jordanians are Syrian ($99,215, a difference of 0.030%), Immigrants from Northern Africa ($99,232, a difference of 0.050%), Swedish ($99,136, a difference of 0.050%), Portuguese ($99,429, a difference of 0.24%), and Carpatho Rusyn ($99,449, a difference of 0.27%).
| Demographics | Rating | Rank | Householder Income Ages 25 - 44 years |
| Poles | 94.5 /100 | #112 | Exceptional $99,685 |
| Tongans | 94.2 /100 | #113 | Exceptional $99,604 |
| Immigrants | Western Asia | 94.0 /100 | #114 | Exceptional $99,516 |
| Carpatho Rusyns | 93.7 /100 | #115 | Exceptional $99,449 |
| Portuguese | 93.7 /100 | #116 | Exceptional $99,429 |
| Immigrants | Northern Africa | 93.0 /100 | #117 | Exceptional $99,232 |
| Syrians | 92.9 /100 | #118 | Exceptional $99,215 |
| Jordanians | 92.8 /100 | #119 | Exceptional $99,186 |
| Swedes | 92.7 /100 | #120 | Exceptional $99,136 |
| Peruvians | 91.7 /100 | #121 | Exceptional $98,886 |
| Immigrants | Uzbekistan | 91.5 /100 | #122 | Exceptional $98,849 |
| Palestinians | 91.2 /100 | #123 | Exceptional $98,777 |
| Zimbabweans | 90.3 /100 | #124 | Exceptional $98,586 |
| Pakistanis | 89.3 /100 | #125 | Excellent $98,401 |
| British | 89.1 /100 | #126 | Excellent $98,359 |
Demographics Similar to Moroccans by Householder Income Ages 25 - 44 years
In terms of householder income ages 25 - 44 years, the demographic groups most similar to Moroccans are Immigrants from Germany ($95,913, a difference of 0.21%), Slavic ($96,377, a difference of 0.27%), Slovene ($96,439, a difference of 0.33%), South American Indian ($96,497, a difference of 0.40%), and Czech ($96,525, a difference of 0.42%).
| Demographics | Rating | Rank | Householder Income Ages 25 - 44 years |
| Irish | 76.9 /100 | #148 | Good $96,730 |
| Basques | 76.6 /100 | #149 | Good $96,709 |
| Ugandans | 76.2 /100 | #150 | Good $96,667 |
| Czechs | 74.8 /100 | #151 | Good $96,525 |
| South American Indians | 74.5 /100 | #152 | Good $96,497 |
| Slovenes | 73.9 /100 | #153 | Good $96,439 |
| Slavs | 73.2 /100 | #154 | Good $96,377 |
| Moroccans | 70.3 /100 | #155 | Good $96,117 |
| Immigrants | Germany | 67.9 /100 | #156 | Good $95,913 |
| Immigrants | Uganda | 65.2 /100 | #157 | Good $95,698 |
| Scandinavians | 63.9 /100 | #158 | Good $95,596 |
| Costa Ricans | 63.5 /100 | #159 | Good $95,565 |
| Icelanders | 63.4 /100 | #160 | Good $95,560 |
| Immigrants | Portugal | 62.8 /100 | #161 | Good $95,512 |
| Swiss | 62.8 /100 | #162 | Good $95,511 |