Japanese vs Northern European Householder Income Ages 25 - 44 years

COMPARE

Japanese
Race
Ancestry
AfghanAfricanAlaska NativeAlaskan AthabascanAlbanianAleutAlsatianAmericanApacheArabArapahoArgentineanArmenianAssyrian/Chaldean/SyriacAustralianAustrianBahamianBangladeshiBarbadianBasqueBelgianBelizeanBermudanBhutaneseBlackfeetBolivianBrazilianBritishBritish West IndianBulgarianBurmeseCajunCambodianCanadianCape VerdeanCarpatho RusynCelticCentral AmericanCentral American IndianCherokeeCheyenneChickasawChileanChineseChippewaChoctawColombianColvilleComancheCosta RicanCreeCreekCroatianCrowCubanCypriotCzechCzechoslovakianDanishDelawareDominicanDutchDutch West IndianEastern EuropeanEcuadorianEgyptianEnglishEstonianEthiopianEuropeanFijianFilipinoFinnishFrenchFrench American IndianFrench CanadianGermanGerman RussianGhanaianGreekGuamanian/ChamorroGuatemalanGuyaneseHaitianHmongHonduranHopiHoumaHungarianIcelanderIndian (Asian)IndonesianInupiatIranianIraqiIrishIroquoisIsraeliItalianJamaicanJapaneseJordanianKenyanKiowaKoreanLaotianLatvianLebaneseLiberianLithuanianLumbeeLuxembourgerMacedonianMalaysianMalteseMarshalleseMenomineeMexicanMexican American IndianMongolianMoroccanNative HawaiianNavajoNepaleseNew ZealanderNicaraguanNigerianNorwegianOkinawanOsageOttawaPaiutePakistaniPalestinianPanamanianParaguayanPennsylvania GermanPeruvianPimaPolishPortuguesePotawatomiPuebloPuerto RicanPuget Sound SalishRomanianRussianSalvadoranSamoanScandinavianScotch-IrishScottishSeminoleSenegaleseSerbianShoshoneSierra LeoneanSiouxSlavicSlovakSloveneSomaliSouth AfricanSouth AmericanSouth American IndianSoviet UnionSpaniardSpanishSpanish AmericanSpanish American IndianSri LankanSubsaharan AfricanSudaneseSwedishSwissSyrianTaiwaneseThaiTlingit-HaidaTohono O'OdhamTonganTrinidadian and TobagonianTsimshianTurkishU.S. Virgin IslanderUgandanUkrainianUruguayanUteVenezuelanVietnameseWelshWest IndianYakamaYaquiYugoslavianYumanYup'ikZimbabwean
Immigration
NonimmigrantsImmigrantsAfghanistanAfricaAlbaniaArgentinaArmeniaAsiaAustraliaAustriaBahamasBangladeshBarbadosBelarusBelgiumBelizeBoliviaBosnia and HerzegovinaBrazilBulgariaBurma/MyanmarCabo VerdeCambodiaCameroonCanadaCaribbeanCentral AmericaChileChinaColombiaCongoCosta RicaCroatiaCubaCzechoslovakiaDenmarkDominicaDominican RepublicEastern AfricaEastern AsiaEastern EuropeEcuadorEgyptEl SalvadorEnglandEritreaEthiopiaEuropeFijiFranceGermanyGhanaGreeceGrenadaGuatemalaGuyanaHaitiHondurasHong KongHungaryIndiaIndonesiaIranIraqIrelandIsraelItalyJamaicaJapanJordanKazakhstanKenyaKoreaKuwaitLaosLatin AmericaLatviaLebanonLiberiaLithuaniaMalaysiaMexicoMicronesiaMiddle AfricaMoldovaMoroccoNepalNetherlandsNicaraguaNigeriaNorth AmericaNorth MacedoniaNorthern AfricaNorthern EuropeNorwayOceaniaPakistanPanamaPeruPhilippinesPolandPortugalRomaniaRussiaSaudi ArabiaScotlandSenegalSerbiaSierra LeoneSingaporeSomaliaSouth AfricaSouth AmericaSouth Central AsiaSouth Eastern AsiaSouthern EuropeSpainSri LankaSt. Vincent and the GrenadinesSudanSwedenSwitzerlandSyriaTaiwanThailandTrinidad and TobagoTurkeyUgandaUkraineUruguayUzbekistanVenezuelaVietnamWest IndiesWestern AfricaWestern AsiaWestern EuropeYemenZaireZimbabweAzores
Northern European
Race
Ancestry
AfghanAfricanAlaska NativeAlaskan AthabascanAlbanianAleutAlsatianAmericanApacheArabArapahoArgentineanArmenianAssyrian/Chaldean/SyriacAustralianAustrianBahamianBangladeshiBarbadianBasqueBelgianBelizeanBermudanBhutaneseBlackfeetBolivianBrazilianBritishBritish West IndianBulgarianBurmeseCajunCambodianCanadianCape VerdeanCarpatho RusynCelticCentral AmericanCentral American IndianCherokeeCheyenneChickasawChileanChineseChippewaChoctawColombianColvilleComancheCosta RicanCreeCreekCroatianCrowCubanCypriotCzechCzechoslovakianDanishDelawareDominicanDutchDutch West IndianEastern EuropeanEcuadorianEgyptianEnglishEstonianEthiopianEuropeanFijianFilipinoFinnishFrenchFrench American IndianFrench CanadianGermanGerman RussianGhanaianGreekGuamanian/ChamorroGuatemalanGuyaneseHaitianHmongHonduranHopiHoumaHungarianIcelanderIndian (Asian)IndonesianInupiatIranianIraqiIrishIroquoisIsraeliItalianJamaicanJordanianKenyanKiowaKoreanLaotianLatvianLebaneseLiberianLithuanianLumbeeLuxembourgerMacedonianMalaysianMalteseMarshalleseMenomineeMexicanMexican American IndianMongolianMoroccanNative HawaiianNavajoNepaleseNew ZealanderNicaraguanNigerianNorthern EuropeanNorwegianOkinawanOsageOttawaPaiutePakistaniPalestinianPanamanianParaguayanPennsylvania GermanPeruvianPimaPolishPortuguesePotawatomiPuebloPuerto RicanPuget Sound SalishRomanianRussianSalvadoranSamoanScandinavianScotch-IrishScottishSeminoleSenegaleseSerbianShoshoneSierra LeoneanSiouxSlavicSlovakSloveneSomaliSouth AfricanSouth AmericanSouth American IndianSoviet UnionSpaniardSpanishSpanish AmericanSpanish American IndianSri LankanSubsaharan AfricanSudaneseSwedishSwissSyrianTaiwaneseThaiTlingit-HaidaTohono O'OdhamTonganTrinidadian and TobagonianTsimshianTurkishU.S. Virgin IslanderUgandanUkrainianUruguayanUteVenezuelanVietnameseWelshWest IndianYakamaYaquiYugoslavianYumanYup'ikZimbabwean
Immigration
NonimmigrantsImmigrantsAfghanistanAfricaAlbaniaArgentinaArmeniaAsiaAustraliaAustriaBahamasBangladeshBarbadosBelarusBelgiumBelizeBoliviaBosnia and HerzegovinaBrazilBulgariaBurma/MyanmarCabo VerdeCambodiaCameroonCanadaCaribbeanCentral AmericaChileChinaColombiaCongoCosta RicaCroatiaCubaCzechoslovakiaDenmarkDominicaDominican RepublicEastern AfricaEastern AsiaEastern EuropeEcuadorEgyptEl SalvadorEnglandEritreaEthiopiaEuropeFijiFranceGermanyGhanaGreeceGrenadaGuatemalaGuyanaHaitiHondurasHong KongHungaryIndiaIndonesiaIranIraqIrelandIsraelItalyJamaicaJapanJordanKazakhstanKenyaKoreaKuwaitLaosLatin AmericaLatviaLebanonLiberiaLithuaniaMalaysiaMexicoMicronesiaMiddle AfricaMoldovaMoroccoNepalNetherlandsNicaraguaNigeriaNorth AmericaNorth MacedoniaNorthern AfricaNorthern EuropeNorwayOceaniaPakistanPanamaPeruPhilippinesPolandPortugalRomaniaRussiaSaudi ArabiaScotlandSenegalSerbiaSierra LeoneSingaporeSomaliaSouth AfricaSouth AmericaSouth Central AsiaSouth Eastern AsiaSouthern EuropeSpainSri LankaSt. Vincent and the GrenadinesSudanSwedenSwitzerlandSyriaTaiwanThailandTrinidad and TobagoTurkeyUgandaUkraineUruguayUzbekistanVenezuelaVietnamWest IndiesWestern AfricaWestern AsiaWestern EuropeYemenZaireZimbabweAzores
Householder Income Ages 25 - 44 years
Income
Poverty
Unemployment
Labor Participation
Family Structure
Vehicle Availability
Education Level
Disability

Householder Income Ages 25 - 44 years Comparison

Japanese

Northern Europeans

Poor
Exceptional
$91,624
HOUSEHOLDER INCOME AGES 25 - 44 YEARS
16.4/ 100
METRIC RATING
201st/ 347
METRIC RANK
$100,457
HOUSEHOLDER INCOME AGES 25 - 44 YEARS
96.3/ 100
METRIC RATING
107th/ 347
METRIC RANK

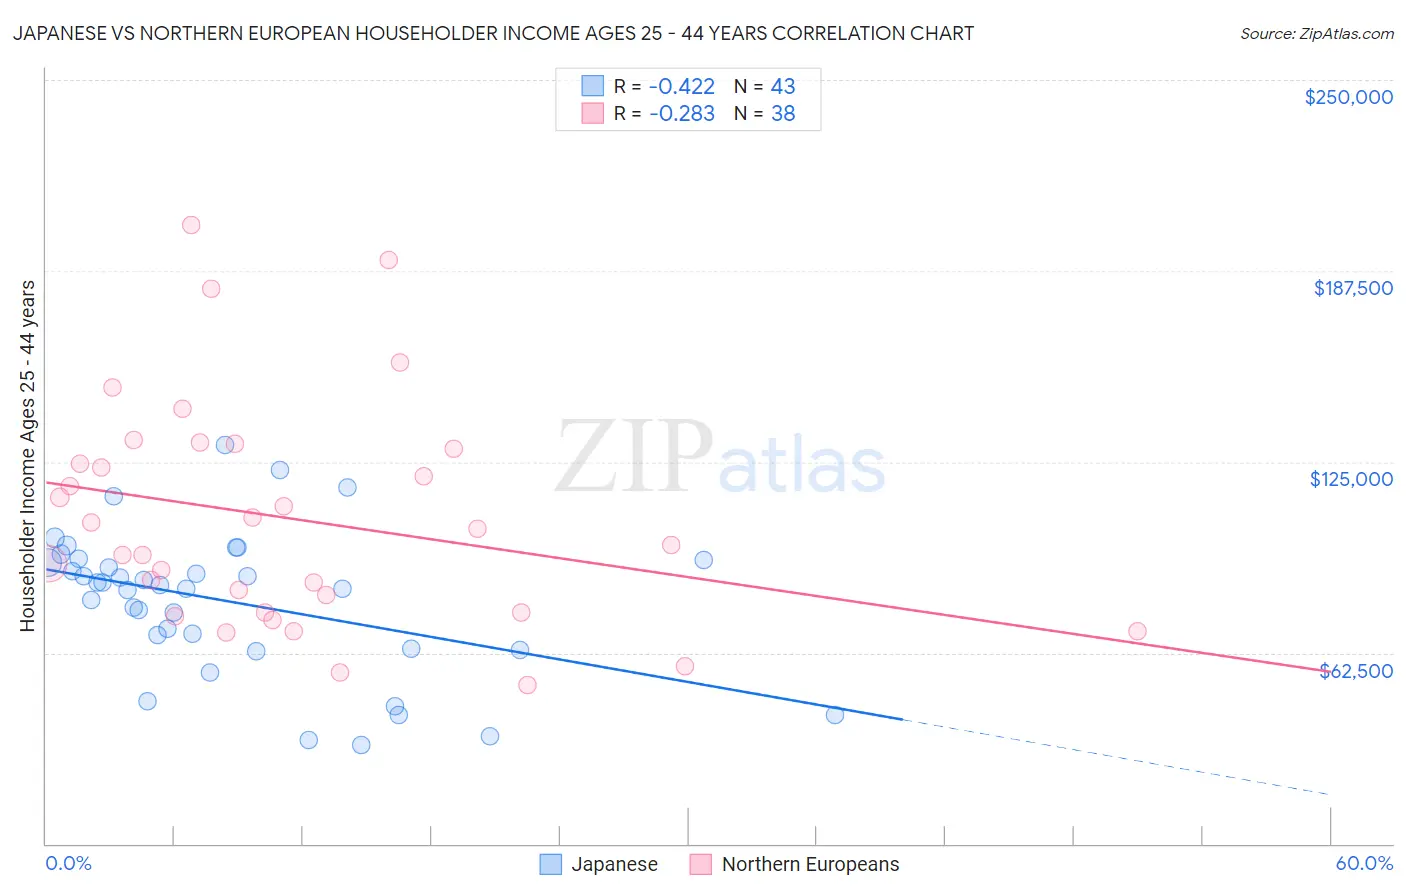
Japanese vs Northern European Householder Income Ages 25 - 44 years Correlation Chart

The statistical analysis conducted on geographies consisting of 248,932,234 people shows a moderate negative correlation between the proportion of Japanese and household income with householder between the ages 25 and 44 in the United States with a correlation coefficient (R) of -0.422 and weighted average of $91,624. Similarly, the statistical analysis conducted on geographies consisting of 404,748,237 people shows a weak negative correlation between the proportion of Northern Europeans and household income with householder between the ages 25 and 44 in the United States with a correlation coefficient (R) of -0.283 and weighted average of $100,457, a difference of 9.6%.
Japanese vs Northern European Householder Income Ages 25 - 44 years

Householder Income Ages 25 - 44 years Correlation Summary

MeasurementJapaneseNorthern European
Minimum$32,434$51,817
Maximum$130,694$202,571
Range$98,260$150,754
Mean$79,326$106,570
Median$84,545$100,458
Interquartile 25% (IQ1)$63,836$75,848
Interquartile 75% (IQ3)$92,776$129,485
Interquartile Range (IQR)$28,940$53,637
Standard Deviation (Sample)$23,298$36,774
Standard Deviation (Population)$23,025$36,287

Similar Demographics by Householder Income Ages 25 - 44 years

Demographics Similar to Japanese by Householder Income Ages 25 - 44 years

In terms of householder income ages 25 - 44 years, the demographic groups most similar to Japanese are White/Caucasian ($91,668, a difference of 0.050%), Ecuadorian ($91,574, a difference of 0.050%), Kenyan ($91,684, a difference of 0.070%), Immigrants from Cambodia ($91,533, a difference of 0.10%), and Nepalese ($91,498, a difference of 0.14%).
DemographicsRating | RankHouseholder Income Ages 25 - 44 years
Immigrants | Azores
22.4
/100
|
#194
Fair
$92,322
Celtics
21.6
/100
|
#195
Fair
$92,241
Immigrants | Colombia
21.3
/100
|
#196
Fair
$92,204
Spanish
21.2
/100
|
#197
Fair
$92,200
Vietnamese
20.2
/100
|
#198
Fair
$92,089
Kenyans
16.8
/100
|
#199
Poor
$91,684
Whites/Caucasians
16.7
/100
|
#200
Poor
$91,668
Japanese
16.4
/100
|
#201
Poor
$91,624
Ecuadorians
16.0
/100
|
#202
Poor
$91,574
Immigrants | Cambodia
15.7
/100
|
#203
Poor
$91,533
Nepalese
15.4
/100
|
#204
Poor
$91,498
Immigrants | Eastern Africa
15.2
/100
|
#205
Poor
$91,458
Aleuts
14.5
/100
|
#206
Poor
$91,370
Yugoslavians
14.5
/100
|
#207
Poor
$91,368
Immigrants | Thailand
14.3
/100
|
#208
Poor
$91,337

Demographics Similar to Northern Europeans by Householder Income Ages 25 - 44 years

In terms of householder income ages 25 - 44 years, the demographic groups most similar to Northern Europeans are Immigrants from Vietnam ($100,535, a difference of 0.080%), Immigrants from Brazil ($100,534, a difference of 0.080%), Immigrants from South Eastern Asia ($100,283, a difference of 0.17%), Immigrants from North Macedonia ($100,101, a difference of 0.36%), and Immigrants from Afghanistan ($99,977, a difference of 0.48%).
DemographicsRating | RankHouseholder Income Ages 25 - 44 years
Immigrants | Argentina
97.8
/100
|
#100
Exceptional
$101,415
Albanians
97.8
/100
|
#101
Exceptional
$101,367
Immigrants | Lebanon
97.4
/100
|
#102
Exceptional
$101,124
Immigrants | Moldova
97.4
/100
|
#103
Exceptional
$101,091
Immigrants | Poland
97.4
/100
|
#104
Exceptional
$101,065
Immigrants | Vietnam
96.5
/100
|
#105
Exceptional
$100,535
Immigrants | Brazil
96.5
/100
|
#106
Exceptional
$100,534
Northern Europeans
96.3
/100
|
#107
Exceptional
$100,457
Immigrants | South Eastern Asia
96.0
/100
|
#108
Exceptional
$100,283
Immigrants | North Macedonia
95.6
/100
|
#109
Exceptional
$100,101
Immigrants | Afghanistan
95.3
/100
|
#110
Exceptional
$99,977
Chileans
95.1
/100
|
#111
Exceptional
$99,900
Poles
94.5
/100
|
#112
Exceptional
$99,685
Tongans
94.2
/100
|
#113
Exceptional
$99,604
Immigrants | Western Asia
94.0
/100
|
#114
Exceptional
$99,516