Japanese vs Belgian Median Earnings
COMPARE
Japanese
Belgian
Median Earnings
Median Earnings Comparison
Japanese
Belgians
$44,825
MEDIAN EARNINGS
9.5/ 100
METRIC RATING
231st/ 347
METRIC RANK
$46,375
MEDIAN EARNINGS
48.0/ 100
METRIC RATING
177th/ 347
METRIC RANK
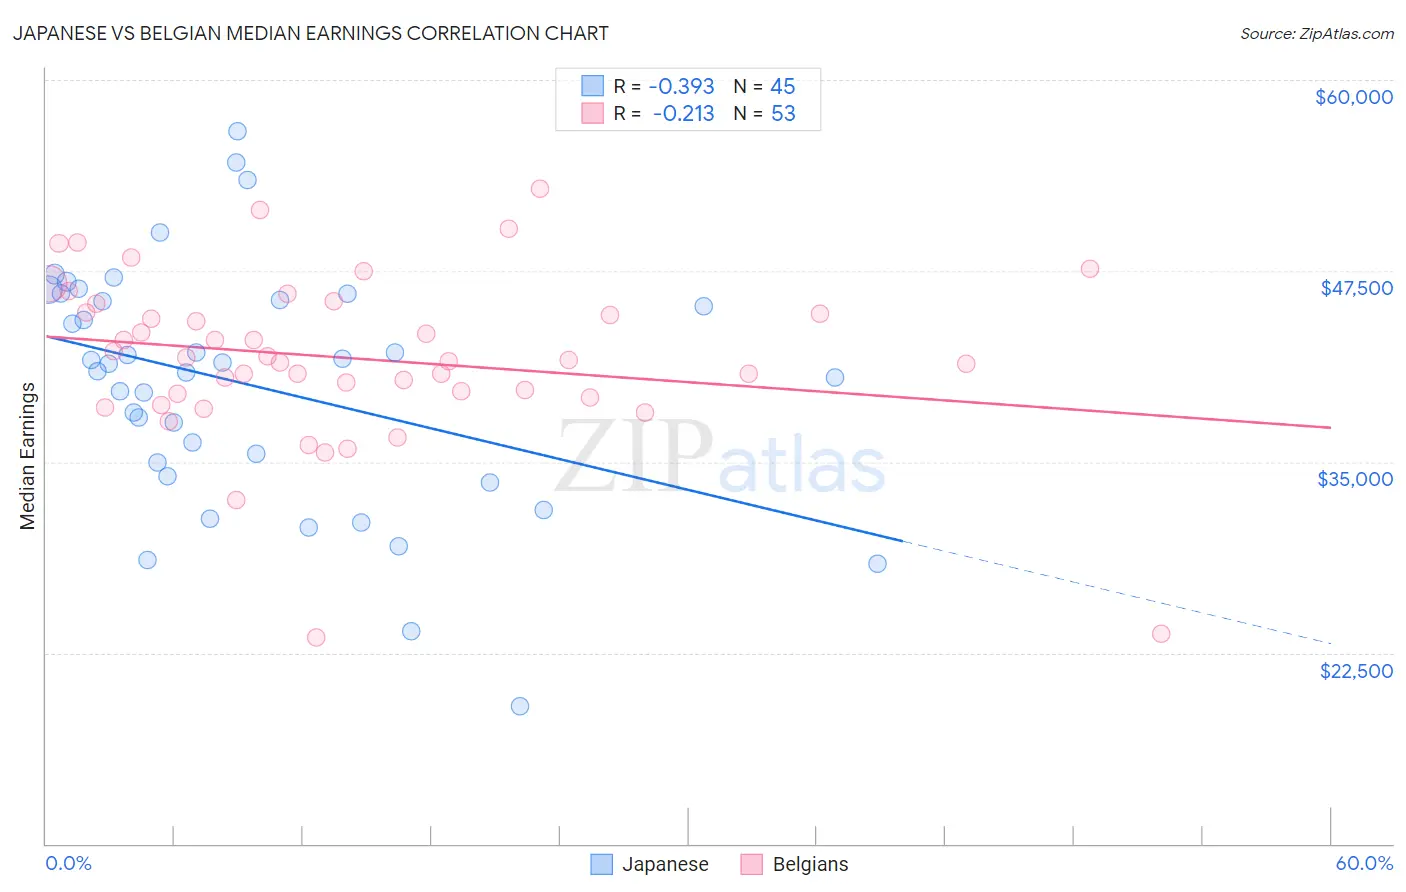
Japanese vs Belgian Median Earnings Correlation Chart
The statistical analysis conducted on geographies consisting of 249,187,165 people shows a mild negative correlation between the proportion of Japanese and median earnings in the United States with a correlation coefficient (R) of -0.393 and weighted average of $44,825. Similarly, the statistical analysis conducted on geographies consisting of 356,004,504 people shows a weak negative correlation between the proportion of Belgians and median earnings in the United States with a correlation coefficient (R) of -0.213 and weighted average of $46,375, a difference of 3.5%.
Median Earnings Correlation Summary
| Measurement | Japanese | Belgian |
| Minimum | $19,004 | $23,500 |
| Maximum | $56,680 | $52,848 |
| Range | $37,676 | $29,348 |
| Mean | $40,035 | $41,793 |
| Median | $41,417 | $41,635 |
| Interquartile 25% (IQ1) | $34,525 | $39,329 |
| Interquartile 75% (IQ3) | $45,796 | $45,075 |
| Interquartile Range (IQR) | $11,271 | $5,747 |
| Standard Deviation (Sample) | $7,916 | $5,579 |
| Standard Deviation (Population) | $7,827 | $5,526 |
Similar Demographics by Median Earnings
Demographics Similar to Japanese by Median Earnings
In terms of median earnings, the demographic groups most similar to Japanese are Delaware ($44,783, a difference of 0.090%), Immigrants from Sudan ($44,767, a difference of 0.13%), Immigrants from Western Africa ($44,893, a difference of 0.15%), Scotch-Irish ($44,924, a difference of 0.22%), and Immigrants from Iraq ($44,988, a difference of 0.37%).
| Demographics | Rating | Rank | Median Earnings |
| West Indians | 13.9 /100 | #224 | Poor $45,132 |
| Immigrants | Cambodia | 13.2 /100 | #225 | Poor $45,090 |
| Immigrants | Nigeria | 12.2 /100 | #226 | Poor $45,030 |
| Native Hawaiians | 12.2 /100 | #227 | Poor $45,027 |
| Immigrants | Iraq | 11.6 /100 | #228 | Poor $44,988 |
| Scotch-Irish | 10.7 /100 | #229 | Poor $44,924 |
| Immigrants | Western Africa | 10.3 /100 | #230 | Poor $44,893 |
| Japanese | 9.5 /100 | #231 | Tragic $44,825 |
| Delaware | 9.0 /100 | #232 | Tragic $44,783 |
| Immigrants | Sudan | 8.8 /100 | #233 | Tragic $44,767 |
| Cape Verdeans | 7.5 /100 | #234 | Tragic $44,640 |
| Venezuelans | 6.9 /100 | #235 | Tragic $44,580 |
| British West Indians | 6.7 /100 | #236 | Tragic $44,552 |
| Immigrants | Ecuador | 5.9 /100 | #237 | Tragic $44,462 |
| Sudanese | 5.6 /100 | #238 | Tragic $44,419 |
Demographics Similar to Belgians by Median Earnings
In terms of median earnings, the demographic groups most similar to Belgians are Danish ($46,392, a difference of 0.040%), Basque ($46,399, a difference of 0.050%), Colombian ($46,349, a difference of 0.060%), English ($46,334, a difference of 0.090%), and Puget Sound Salish ($46,333, a difference of 0.090%).
| Demographics | Rating | Rank | Median Earnings |
| Immigrants | Immigrants | 51.6 /100 | #170 | Average $46,478 |
| Scottish | 51.1 /100 | #171 | Average $46,463 |
| Kenyans | 51.0 /100 | #172 | Average $46,462 |
| Ghanaians | 50.3 /100 | #173 | Average $46,440 |
| Scandinavians | 50.0 /100 | #174 | Average $46,433 |
| Basques | 48.8 /100 | #175 | Average $46,399 |
| Danes | 48.6 /100 | #176 | Average $46,392 |
| Belgians | 48.0 /100 | #177 | Average $46,375 |
| Colombians | 47.1 /100 | #178 | Average $46,349 |
| English | 46.5 /100 | #179 | Average $46,334 |
| Puget Sound Salish | 46.5 /100 | #180 | Average $46,333 |
| Immigrants | Cameroon | 46.4 /100 | #181 | Average $46,329 |
| Swiss | 45.9 /100 | #182 | Average $46,315 |
| French | 45.2 /100 | #183 | Average $46,296 |
| Immigrants | Kenya | 42.4 /100 | #184 | Average $46,214 |