Jamaican vs Kiowa Median Household Income
COMPARE
Jamaican
Kiowa
Median Household Income
Median Household Income Comparison
Jamaicans
Kiowa
$76,583
MEDIAN HOUSEHOLD INCOME
0.4/ 100
METRIC RATING
260th/ 347
METRIC RANK
$65,914
MEDIAN HOUSEHOLD INCOME
0.0/ 100
METRIC RATING
337th/ 347
METRIC RANK
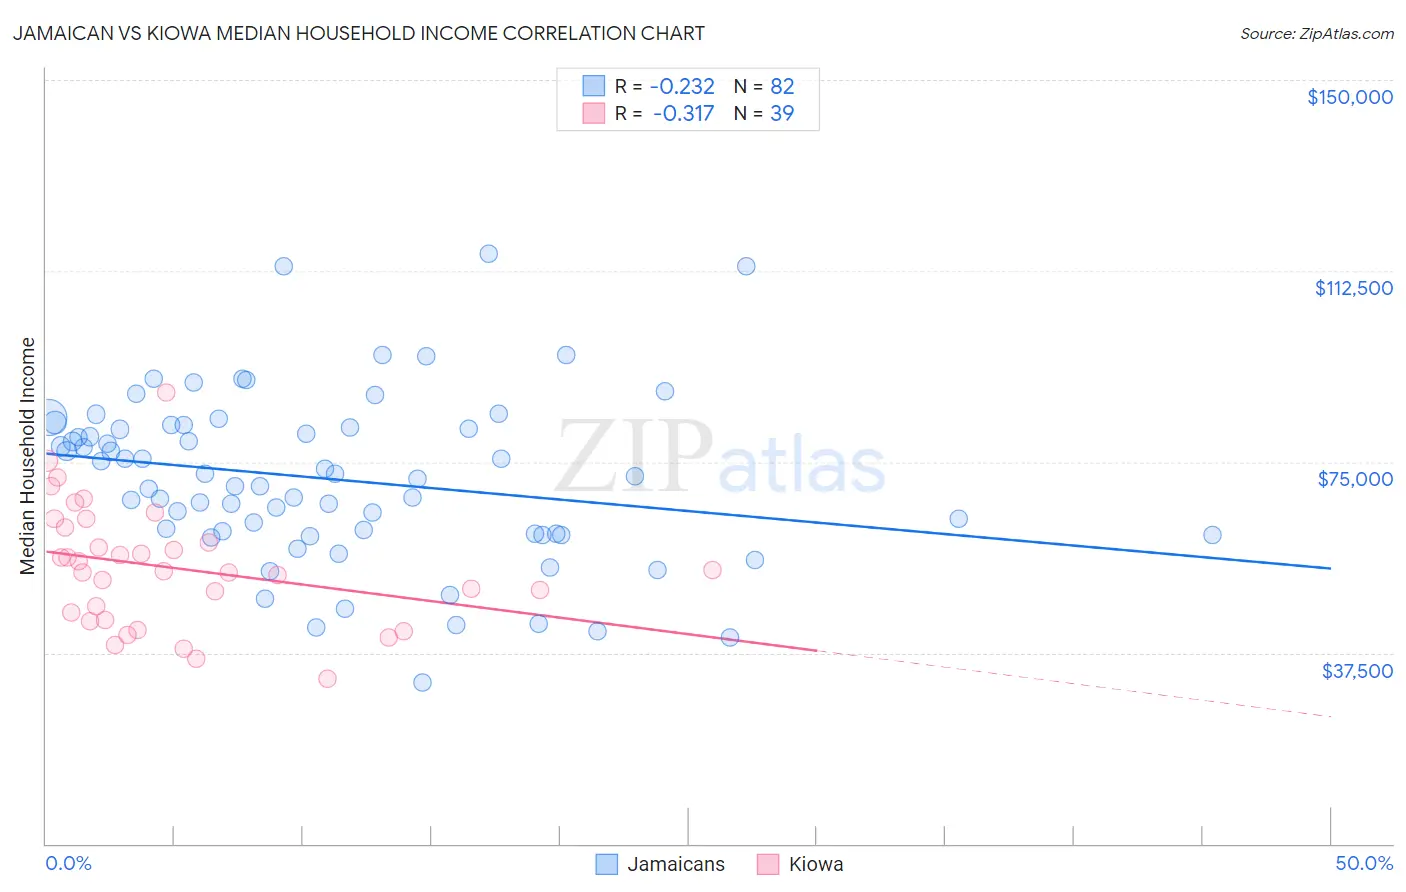
Jamaican vs Kiowa Median Household Income Correlation Chart
The statistical analysis conducted on geographies consisting of 367,555,449 people shows a weak negative correlation between the proportion of Jamaicans and median household income in the United States with a correlation coefficient (R) of -0.232 and weighted average of $76,583. Similarly, the statistical analysis conducted on geographies consisting of 56,098,760 people shows a mild negative correlation between the proportion of Kiowa and median household income in the United States with a correlation coefficient (R) of -0.317 and weighted average of $65,914, a difference of 16.2%.
Median Household Income Correlation Summary
| Measurement | Jamaican | Kiowa |
| Minimum | $31,580 | $32,500 |
| Maximum | $115,872 | $88,558 |
| Range | $84,292 | $56,058 |
| Mean | $71,605 | $54,131 |
| Median | $71,865 | $53,438 |
| Interquartile 25% (IQ1) | $60,801 | $43,977 |
| Interquartile 75% (IQ3) | $81,812 | $62,181 |
| Interquartile Range (IQR) | $21,011 | $18,204 |
| Standard Deviation (Sample) | $16,569 | $11,836 |
| Standard Deviation (Population) | $16,468 | $11,684 |
Similar Demographics by Median Household Income
Demographics Similar to Jamaicans by Median Household Income
In terms of median household income, the demographic groups most similar to Jamaicans are Immigrants from Grenada ($76,517, a difference of 0.090%), Spanish American Indian ($76,670, a difference of 0.11%), Immigrants from Nicaragua ($76,784, a difference of 0.26%), French American Indian ($76,387, a difference of 0.26%), and Alaskan Athabascan ($76,383, a difference of 0.26%).
| Demographics | Rating | Rank | Median Household Income |
| Immigrants | St. Vincent and the Grenadines | 0.9 /100 | #253 | Tragic $77,690 |
| Sub-Saharan Africans | 0.8 /100 | #254 | Tragic $77,631 |
| Immigrants | Middle Africa | 0.8 /100 | #255 | Tragic $77,559 |
| Belizeans | 0.6 /100 | #256 | Tragic $77,028 |
| Immigrants | Senegal | 0.5 /100 | #257 | Tragic $76,915 |
| Immigrants | Nicaragua | 0.5 /100 | #258 | Tragic $76,784 |
| Spanish American Indians | 0.4 /100 | #259 | Tragic $76,670 |
| Jamaicans | 0.4 /100 | #260 | Tragic $76,583 |
| Immigrants | Grenada | 0.4 /100 | #261 | Tragic $76,517 |
| French American Indians | 0.4 /100 | #262 | Tragic $76,387 |
| Alaskan Athabascans | 0.4 /100 | #263 | Tragic $76,383 |
| Guatemalans | 0.3 /100 | #264 | Tragic $75,961 |
| Immigrants | Belize | 0.3 /100 | #265 | Tragic $75,938 |
| Americans | 0.3 /100 | #266 | Tragic $75,932 |
| German Russians | 0.3 /100 | #267 | Tragic $75,856 |
Demographics Similar to Kiowa by Median Household Income
In terms of median household income, the demographic groups most similar to Kiowa are Immigrants from Yemen ($65,194, a difference of 1.1%), Immigrants from Congo ($66,768, a difference of 1.3%), Hopi ($65,043, a difference of 1.3%), Cheyenne ($66,974, a difference of 1.6%), and Pueblo ($64,692, a difference of 1.9%).
| Demographics | Rating | Rank | Median Household Income |
| Arapaho | 0.0 /100 | #330 | Tragic $67,965 |
| Natives/Alaskans | 0.0 /100 | #331 | Tragic $67,879 |
| Sioux | 0.0 /100 | #332 | Tragic $67,792 |
| Creek | 0.0 /100 | #333 | Tragic $67,715 |
| Blacks/African Americans | 0.0 /100 | #334 | Tragic $67,573 |
| Cheyenne | 0.0 /100 | #335 | Tragic $66,974 |
| Immigrants | Congo | 0.0 /100 | #336 | Tragic $66,768 |
| Kiowa | 0.0 /100 | #337 | Tragic $65,914 |
| Immigrants | Yemen | 0.0 /100 | #338 | Tragic $65,194 |
| Hopi | 0.0 /100 | #339 | Tragic $65,043 |
| Pueblo | 0.0 /100 | #340 | Tragic $64,692 |
| Crow | 0.0 /100 | #341 | Tragic $63,681 |
| Pima | 0.0 /100 | #342 | Tragic $63,262 |
| Houma | 0.0 /100 | #343 | Tragic $62,575 |
| Tohono O'odham | 0.0 /100 | #344 | Tragic $61,663 |