Jamaican vs Bolivian Householder Income Over 65 years
COMPARE
Jamaican
Bolivian
Householder Income Over 65 years
Householder Income Over 65 years Comparison
Jamaicans
Bolivians
$54,560
HOUSEHOLDER INCOME OVER 65 YEARS
0.1/ 100
METRIC RATING
266th/ 347
METRIC RANK
$74,245
HOUSEHOLDER INCOME OVER 65 YEARS
100.0/ 100
METRIC RATING
6th/ 347
METRIC RANK
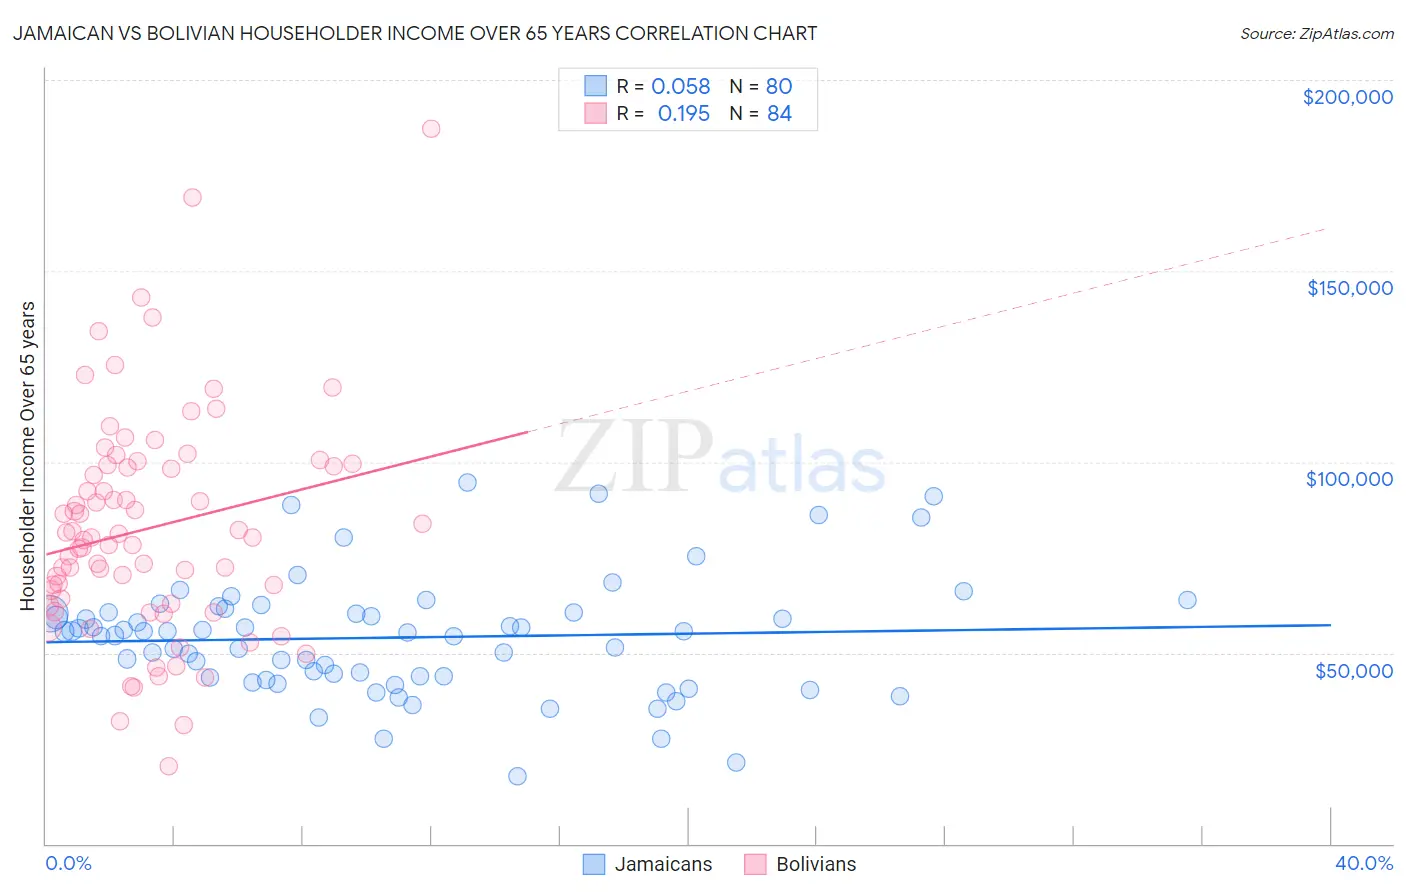
Jamaican vs Bolivian Householder Income Over 65 years Correlation Chart
The statistical analysis conducted on geographies consisting of 366,342,723 people shows a slight positive correlation between the proportion of Jamaicans and household income with householder over the age of 65 in the United States with a correlation coefficient (R) of 0.058 and weighted average of $54,560. Similarly, the statistical analysis conducted on geographies consisting of 184,404,037 people shows a poor positive correlation between the proportion of Bolivians and household income with householder over the age of 65 in the United States with a correlation coefficient (R) of 0.195 and weighted average of $74,245, a difference of 36.1%.
Householder Income Over 65 years Correlation Summary
| Measurement | Jamaican | Bolivian |
| Minimum | $17,596 | $20,142 |
| Maximum | $94,474 | $187,273 |
| Range | $76,878 | $167,131 |
| Mean | $53,994 | $82,611 |
| Median | $55,397 | $80,185 |
| Interquartile 25% (IQ1) | $43,595 | $63,404 |
| Interquartile 75% (IQ3) | $60,577 | $98,957 |
| Interquartile Range (IQR) | $16,982 | $35,553 |
| Standard Deviation (Sample) | $15,398 | $29,052 |
| Standard Deviation (Population) | $15,302 | $28,879 |
Similar Demographics by Householder Income Over 65 years
Demographics Similar to Jamaicans by Householder Income Over 65 years
In terms of householder income over 65 years, the demographic groups most similar to Jamaicans are Belizean ($54,580, a difference of 0.040%), Guatemalan ($54,526, a difference of 0.060%), Immigrants from Zaire ($54,512, a difference of 0.090%), Nicaraguan ($54,474, a difference of 0.16%), and Apache ($54,668, a difference of 0.20%).
| Demographics | Rating | Rank | Householder Income Over 65 years |
| West Indians | 0.2 /100 | #259 | Tragic $54,936 |
| Immigrants | West Indies | 0.2 /100 | #260 | Tragic $54,927 |
| Comanche | 0.2 /100 | #261 | Tragic $54,922 |
| Bangladeshis | 0.1 /100 | #262 | Tragic $54,719 |
| French American Indians | 0.1 /100 | #263 | Tragic $54,699 |
| Apache | 0.1 /100 | #264 | Tragic $54,668 |
| Belizeans | 0.1 /100 | #265 | Tragic $54,580 |
| Jamaicans | 0.1 /100 | #266 | Tragic $54,560 |
| Guatemalans | 0.1 /100 | #267 | Tragic $54,526 |
| Immigrants | Zaire | 0.1 /100 | #268 | Tragic $54,512 |
| Nicaraguans | 0.1 /100 | #269 | Tragic $54,474 |
| Immigrants | Senegal | 0.1 /100 | #270 | Tragic $54,447 |
| Liberians | 0.1 /100 | #271 | Tragic $54,356 |
| Potawatomi | 0.1 /100 | #272 | Tragic $54,212 |
| Indonesians | 0.1 /100 | #273 | Tragic $54,176 |
Demographics Similar to Bolivians by Householder Income Over 65 years
In terms of householder income over 65 years, the demographic groups most similar to Bolivians are Immigrants from Bolivia ($73,434, a difference of 1.1%), Immigrants from Iran ($75,081, a difference of 1.1%), Immigrants from Singapore ($72,963, a difference of 1.8%), Immigrants from India ($72,804, a difference of 2.0%), and Bhutanese ($72,288, a difference of 2.7%).
| Demographics | Rating | Rank | Householder Income Over 65 years |
| Chinese | 100.0 /100 | #1 | Exceptional $77,465 |
| Iranians | 100.0 /100 | #2 | Exceptional $77,429 |
| Immigrants | Taiwan | 100.0 /100 | #3 | Exceptional $77,051 |
| Filipinos | 100.0 /100 | #4 | Exceptional $76,686 |
| Immigrants | Iran | 100.0 /100 | #5 | Exceptional $75,081 |
| Bolivians | 100.0 /100 | #6 | Exceptional $74,245 |
| Immigrants | Bolivia | 100.0 /100 | #7 | Exceptional $73,434 |
| Immigrants | Singapore | 100.0 /100 | #8 | Exceptional $72,963 |
| Immigrants | India | 100.0 /100 | #9 | Exceptional $72,804 |
| Bhutanese | 100.0 /100 | #10 | Exceptional $72,288 |
| Thais | 100.0 /100 | #11 | Exceptional $72,099 |
| Cypriots | 100.0 /100 | #12 | Exceptional $71,714 |
| Immigrants | Hong Kong | 100.0 /100 | #13 | Exceptional $71,567 |
| Burmese | 100.0 /100 | #14 | Exceptional $71,139 |
| Native Hawaiians | 100.0 /100 | #15 | Exceptional $71,021 |