Italian vs Hispanic or Latino Householder Income Ages 25 - 44 years
COMPARE
Italian
Hispanic or Latino
Householder Income Ages 25 - 44 years
Householder Income Ages 25 - 44 years Comparison
Italians
Hispanics or Latinos
$104,215
HOUSEHOLDER INCOME AGES 25 - 44 YEARS
99.5/ 100
METRIC RATING
73rd/ 347
METRIC RANK
$80,515
HOUSEHOLDER INCOME AGES 25 - 44 YEARS
0.0/ 100
METRIC RATING
302nd/ 347
METRIC RANK
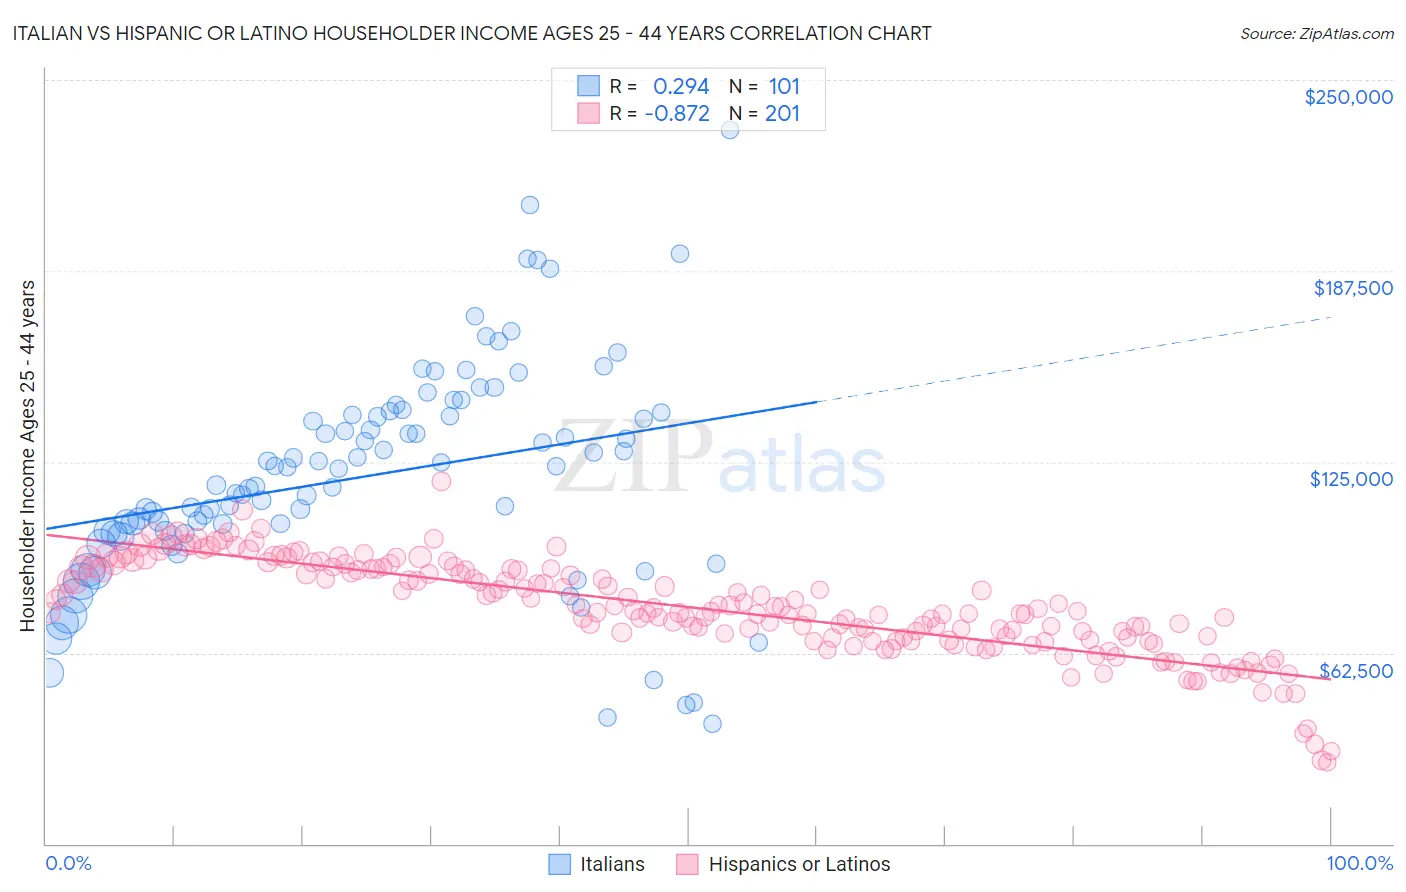
Italian vs Hispanic or Latino Householder Income Ages 25 - 44 years Correlation Chart
The statistical analysis conducted on geographies consisting of 568,883,722 people shows a weak positive correlation between the proportion of Italians and household income with householder between the ages 25 and 44 in the United States with a correlation coefficient (R) of 0.294 and weighted average of $104,215. Similarly, the statistical analysis conducted on geographies consisting of 571,919,072 people shows a very strong negative correlation between the proportion of Hispanics or Latinos and household income with householder between the ages 25 and 44 in the United States with a correlation coefficient (R) of -0.872 and weighted average of $80,515, a difference of 29.4%.
Householder Income Ages 25 - 44 years Correlation Summary
| Measurement | Italian | Hispanic or Latino |
| Minimum | $39,167 | $26,720 |
| Maximum | $233,533 | $118,587 |
| Range | $194,366 | $91,867 |
| Mean | $120,730 | $77,340 |
| Median | $122,854 | $76,240 |
| Interquartile 25% (IQ1) | $102,018 | $67,336 |
| Interquartile 75% (IQ3) | $140,706 | $90,103 |
| Interquartile Range (IQR) | $38,688 | $22,768 |
| Standard Deviation (Sample) | $35,574 | $15,776 |
| Standard Deviation (Population) | $35,397 | $15,737 |
Similar Demographics by Householder Income Ages 25 - 44 years
Demographics Similar to Italians by Householder Income Ages 25 - 44 years
In terms of householder income ages 25 - 44 years, the demographic groups most similar to Italians are Chinese ($104,264, a difference of 0.050%), Afghan ($104,410, a difference of 0.19%), Immigrants from Fiji ($103,954, a difference of 0.25%), Immigrants from Croatia ($104,503, a difference of 0.28%), and Mongolian ($104,578, a difference of 0.35%).
| Demographics | Rating | Rank | Householder Income Ages 25 - 44 years |
| Laotians | 99.7 /100 | #66 | Exceptional $104,993 |
| Immigrants | Romania | 99.6 /100 | #67 | Exceptional $104,713 |
| Immigrants | Eastern Europe | 99.6 /100 | #68 | Exceptional $104,662 |
| Mongolians | 99.6 /100 | #69 | Exceptional $104,578 |
| Immigrants | Croatia | 99.6 /100 | #70 | Exceptional $104,503 |
| Afghans | 99.6 /100 | #71 | Exceptional $104,410 |
| Chinese | 99.5 /100 | #72 | Exceptional $104,264 |
| Italians | 99.5 /100 | #73 | Exceptional $104,215 |
| Immigrants | Fiji | 99.5 /100 | #74 | Exceptional $103,954 |
| Koreans | 99.4 /100 | #75 | Exceptional $103,824 |
| Immigrants | Spain | 99.4 /100 | #76 | Exceptional $103,752 |
| Immigrants | Southern Europe | 99.3 /100 | #77 | Exceptional $103,486 |
| Immigrants | Bulgaria | 99.3 /100 | #78 | Exceptional $103,423 |
| Armenians | 99.2 /100 | #79 | Exceptional $103,248 |
| Immigrants | Egypt | 99.2 /100 | #80 | Exceptional $103,192 |
Demographics Similar to Hispanics or Latinos by Householder Income Ages 25 - 44 years
In terms of householder income ages 25 - 44 years, the demographic groups most similar to Hispanics or Latinos are Immigrants from Micronesia ($80,544, a difference of 0.040%), Mexican ($80,427, a difference of 0.11%), Immigrants from Caribbean ($80,326, a difference of 0.24%), Immigrants from Dominican Republic ($80,319, a difference of 0.24%), and Apache ($80,260, a difference of 0.32%).
| Demographics | Rating | Rank | Householder Income Ages 25 - 44 years |
| Bangladeshis | 0.1 /100 | #295 | Tragic $81,363 |
| Immigrants | Dominica | 0.1 /100 | #296 | Tragic $81,351 |
| Immigrants | Guatemala | 0.1 /100 | #297 | Tragic $81,341 |
| Dominicans | 0.1 /100 | #298 | Tragic $81,229 |
| Immigrants | Liberia | 0.1 /100 | #299 | Tragic $80,863 |
| Cherokee | 0.0 /100 | #300 | Tragic $80,843 |
| Immigrants | Micronesia | 0.0 /100 | #301 | Tragic $80,544 |
| Hispanics or Latinos | 0.0 /100 | #302 | Tragic $80,515 |
| Mexicans | 0.0 /100 | #303 | Tragic $80,427 |
| Immigrants | Caribbean | 0.0 /100 | #304 | Tragic $80,326 |
| Immigrants | Dominican Republic | 0.0 /100 | #305 | Tragic $80,319 |
| Apache | 0.0 /100 | #306 | Tragic $80,260 |
| Haitians | 0.0 /100 | #307 | Tragic $80,055 |
| Immigrants | Central America | 0.0 /100 | #308 | Tragic $80,012 |
| Chippewa | 0.0 /100 | #309 | Tragic $80,005 |