Italian vs French Canadian Median Household Income
COMPARE
Italian
French Canadian
Median Household Income
Median Household Income Comparison
Italians
French Canadians
$92,475
MEDIAN HOUSEHOLD INCOME
99.1/ 100
METRIC RATING
83rd/ 347
METRIC RANK
$82,810
MEDIAN HOUSEHOLD INCOME
18.7/ 100
METRIC RATING
208th/ 347
METRIC RANK
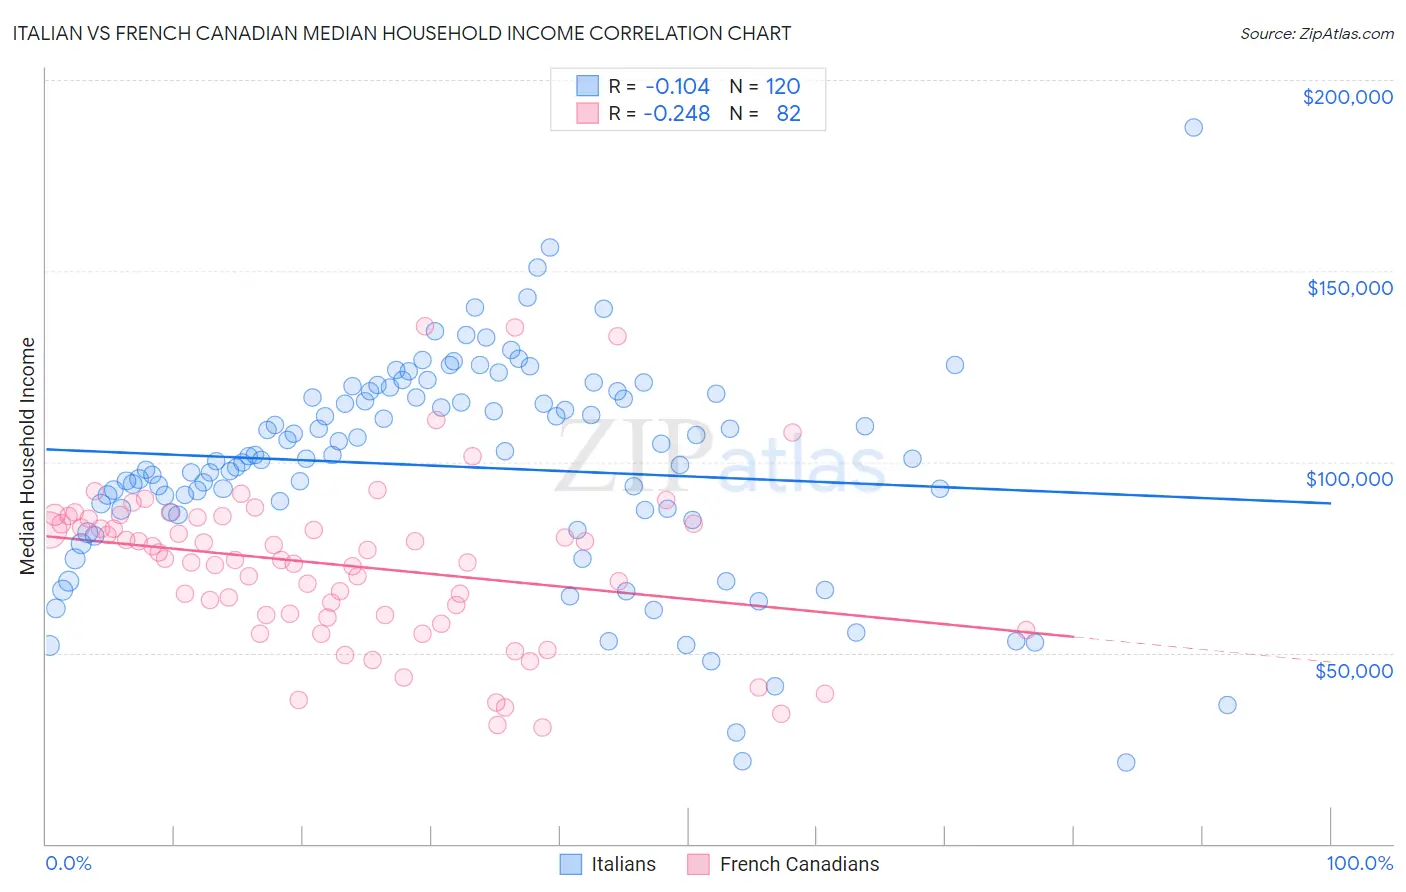
Italian vs French Canadian Median Household Income Correlation Chart
The statistical analysis conducted on geographies consisting of 573,867,135 people shows a poor negative correlation between the proportion of Italians and median household income in the United States with a correlation coefficient (R) of -0.104 and weighted average of $92,475. Similarly, the statistical analysis conducted on geographies consisting of 502,062,501 people shows a weak negative correlation between the proportion of French Canadians and median household income in the United States with a correlation coefficient (R) of -0.248 and weighted average of $82,810, a difference of 11.7%.
Median Household Income Correlation Summary
| Measurement | Italian | French Canadian |
| Minimum | $21,250 | $30,469 |
| Maximum | $187,614 | $135,636 |
| Range | $166,364 | $105,167 |
| Mean | $98,796 | $72,980 |
| Median | $100,721 | $74,466 |
| Interquartile 25% (IQ1) | $86,997 | $59,768 |
| Interquartile 75% (IQ3) | $117,408 | $85,260 |
| Interquartile Range (IQR) | $30,412 | $25,493 |
| Standard Deviation (Sample) | $27,952 | $21,417 |
| Standard Deviation (Population) | $27,836 | $21,286 |
Similar Demographics by Median Household Income
Demographics Similar to Italians by Median Household Income
In terms of median household income, the demographic groups most similar to Italians are Immigrants from Argentina ($92,417, a difference of 0.060%), Immigrants from Croatia ($92,225, a difference of 0.27%), Immigrants from Spain ($92,732, a difference of 0.28%), Immigrants from England ($92,098, a difference of 0.41%), and Immigrants from Hungary ($92,094, a difference of 0.41%).
| Demographics | Rating | Rank | Median Household Income |
| South Africans | 99.5 /100 | #76 | Exceptional $93,379 |
| Immigrants | Afghanistan | 99.5 /100 | #77 | Exceptional $93,375 |
| Immigrants | Bulgaria | 99.4 /100 | #78 | Exceptional $93,148 |
| Sri Lankans | 99.4 /100 | #79 | Exceptional $93,093 |
| Tongans | 99.4 /100 | #80 | Exceptional $93,076 |
| Immigrants | Eastern Europe | 99.4 /100 | #81 | Exceptional $93,051 |
| Immigrants | Spain | 99.3 /100 | #82 | Exceptional $92,732 |
| Italians | 99.1 /100 | #83 | Exceptional $92,475 |
| Immigrants | Argentina | 99.1 /100 | #84 | Exceptional $92,417 |
| Immigrants | Croatia | 99.0 /100 | #85 | Exceptional $92,225 |
| Immigrants | England | 98.9 /100 | #86 | Exceptional $92,098 |
| Immigrants | Hungary | 98.9 /100 | #87 | Exceptional $92,094 |
| Immigrants | Canada | 98.8 /100 | #88 | Exceptional $92,029 |
| Romanians | 98.8 /100 | #89 | Exceptional $91,994 |
| Assyrians/Chaldeans/Syriacs | 98.8 /100 | #90 | Exceptional $91,991 |
Demographics Similar to French Canadians by Median Household Income
In terms of median household income, the demographic groups most similar to French Canadians are Dutch ($82,971, a difference of 0.19%), Immigrants from Iraq ($82,594, a difference of 0.26%), Immigrants from Uruguay ($82,560, a difference of 0.30%), Immigrants from Kenya ($83,068, a difference of 0.31%), and Salvadoran ($82,449, a difference of 0.44%).
| Demographics | Rating | Rank | Median Household Income |
| Spanish | 24.4 /100 | #201 | Fair $83,343 |
| Immigrants | Thailand | 24.3 /100 | #202 | Fair $83,327 |
| Immigrants | Cambodia | 24.0 /100 | #203 | Fair $83,304 |
| Immigrants | Africa | 23.8 /100 | #204 | Fair $83,289 |
| Celtics | 22.7 /100 | #205 | Fair $83,193 |
| Immigrants | Kenya | 21.3 /100 | #206 | Fair $83,068 |
| Dutch | 20.3 /100 | #207 | Fair $82,971 |
| French Canadians | 18.7 /100 | #208 | Poor $82,810 |
| Immigrants | Iraq | 16.7 /100 | #209 | Poor $82,594 |
| Immigrants | Uruguay | 16.4 /100 | #210 | Poor $82,560 |
| Salvadorans | 15.4 /100 | #211 | Poor $82,449 |
| Venezuelans | 15.3 /100 | #212 | Poor $82,432 |
| Nepalese | 15.1 /100 | #213 | Poor $82,410 |
| Panamanians | 14.0 /100 | #214 | Poor $82,272 |
| Vietnamese | 13.8 /100 | #215 | Poor $82,248 |