Israeli vs Immigrants from Sudan Per Capita Income
COMPARE
Israeli
Immigrants from Sudan
Per Capita Income
Per Capita Income Comparison
Israelis
Immigrants from Sudan
$52,596
PER CAPITA INCOME
100.0/ 100
METRIC RATING
29th/ 347
METRIC RANK
$41,986
PER CAPITA INCOME
13.2/ 100
METRIC RATING
209th/ 347
METRIC RANK
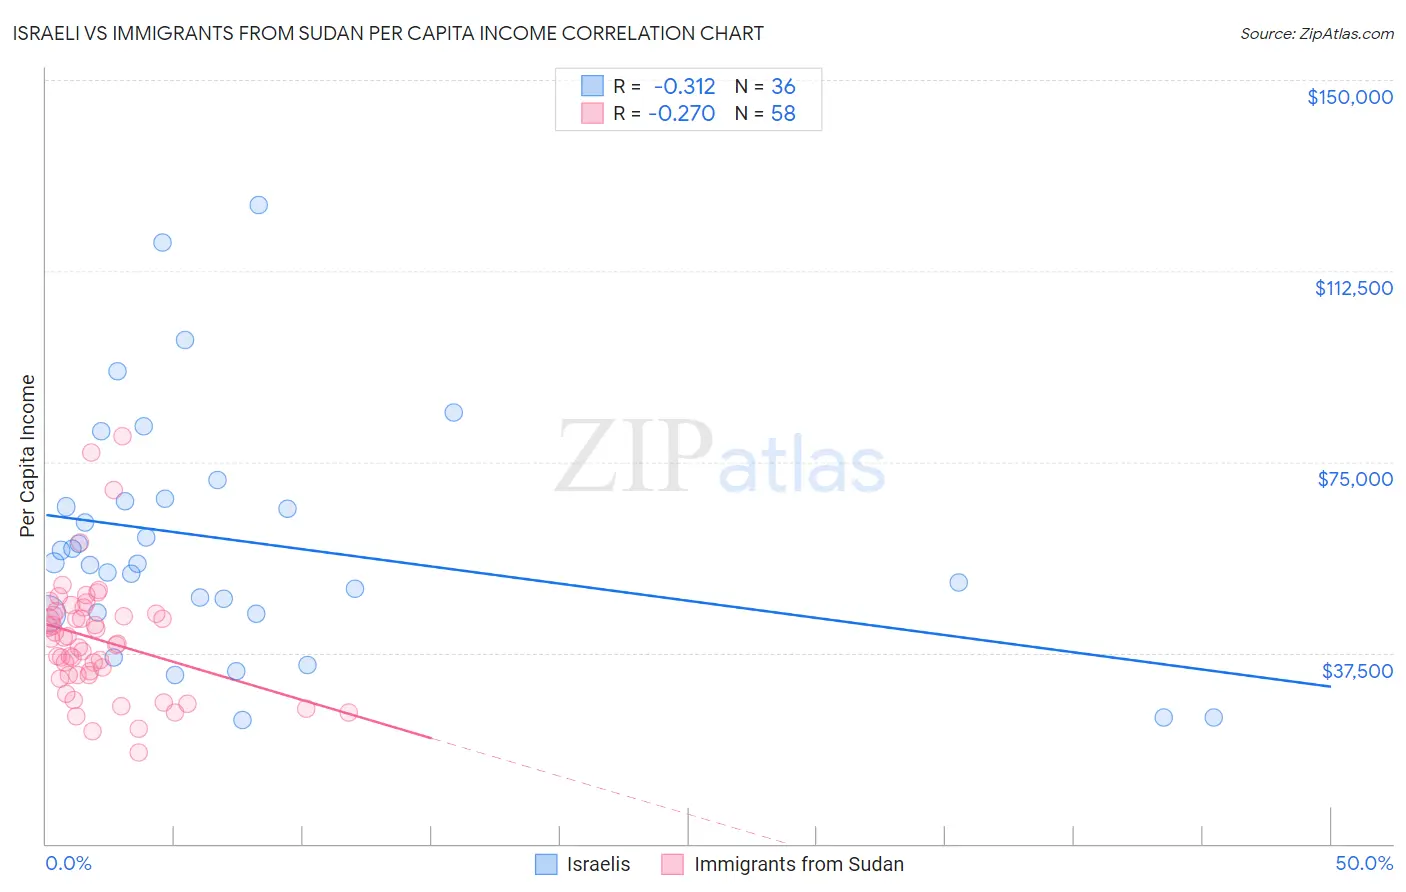
Israeli vs Immigrants from Sudan Per Capita Income Correlation Chart
The statistical analysis conducted on geographies consisting of 211,224,844 people shows a mild negative correlation between the proportion of Israelis and per capita income in the United States with a correlation coefficient (R) of -0.312 and weighted average of $52,596. Similarly, the statistical analysis conducted on geographies consisting of 118,972,993 people shows a weak negative correlation between the proportion of Immigrants from Sudan and per capita income in the United States with a correlation coefficient (R) of -0.270 and weighted average of $41,986, a difference of 25.3%.
Per Capita Income Correlation Summary
| Measurement | Israeli | Immigrants from Sudan |
| Minimum | $24,292 | $17,842 |
| Maximum | $125,412 | $80,005 |
| Range | $101,120 | $62,163 |
| Mean | $59,345 | $40,107 |
| Median | $55,064 | $39,743 |
| Interquartile 25% (IQ1) | $45,317 | $33,055 |
| Interquartile 75% (IQ3) | $67,525 | $45,054 |
| Interquartile Range (IQR) | $22,208 | $11,999 |
| Standard Deviation (Sample) | $23,722 | $11,901 |
| Standard Deviation (Population) | $23,390 | $11,798 |
Similar Demographics by Per Capita Income
Demographics Similar to Israelis by Per Capita Income
In terms of per capita income, the demographic groups most similar to Israelis are Latvian ($52,649, a difference of 0.10%), Immigrants from South Central Asia ($52,660, a difference of 0.12%), Immigrants from Austria ($52,503, a difference of 0.18%), Turkish ($52,391, a difference of 0.39%), and Immigrants from Norway ($52,217, a difference of 0.73%).
| Demographics | Rating | Rank | Per Capita Income |
| Indians (Asian) | 100.0 /100 | #22 | Exceptional $53,874 |
| Immigrants | Eastern Asia | 100.0 /100 | #23 | Exceptional $53,806 |
| Immigrants | Denmark | 100.0 /100 | #24 | Exceptional $53,799 |
| Immigrants | Japan | 100.0 /100 | #25 | Exceptional $53,359 |
| Russians | 100.0 /100 | #26 | Exceptional $53,154 |
| Immigrants | South Central Asia | 100.0 /100 | #27 | Exceptional $52,660 |
| Latvians | 100.0 /100 | #28 | Exceptional $52,649 |
| Israelis | 100.0 /100 | #29 | Exceptional $52,596 |
| Immigrants | Austria | 100.0 /100 | #30 | Exceptional $52,503 |
| Turks | 100.0 /100 | #31 | Exceptional $52,391 |
| Immigrants | Norway | 100.0 /100 | #32 | Exceptional $52,217 |
| Australians | 100.0 /100 | #33 | Exceptional $52,074 |
| Immigrants | Russia | 100.0 /100 | #34 | Exceptional $52,044 |
| Burmese | 100.0 /100 | #35 | Exceptional $52,005 |
| Immigrants | Greece | 100.0 /100 | #36 | Exceptional $51,891 |
Demographics Similar to Immigrants from Sudan by Per Capita Income
In terms of per capita income, the demographic groups most similar to Immigrants from Sudan are Ecuadorian ($41,958, a difference of 0.070%), Panamanian ($42,035, a difference of 0.12%), Venezuelan ($42,074, a difference of 0.21%), Immigrants from Panama ($41,853, a difference of 0.32%), and Immigrants from Senegal ($41,830, a difference of 0.37%).
| Demographics | Rating | Rank | Per Capita Income |
| Immigrants | Bosnia and Herzegovina | 17.5 /100 | #202 | Poor $42,278 |
| Spanish | 17.0 /100 | #203 | Poor $42,249 |
| Aleuts | 16.4 /100 | #204 | Poor $42,210 |
| Whites/Caucasians | 15.9 /100 | #205 | Poor $42,180 |
| Ghanaians | 15.7 /100 | #206 | Poor $42,164 |
| Venezuelans | 14.4 /100 | #207 | Poor $42,074 |
| Panamanians | 13.9 /100 | #208 | Poor $42,035 |
| Immigrants | Sudan | 13.2 /100 | #209 | Poor $41,986 |
| Ecuadorians | 12.9 /100 | #210 | Poor $41,958 |
| Immigrants | Panama | 11.6 /100 | #211 | Poor $41,853 |
| Immigrants | Senegal | 11.3 /100 | #212 | Poor $41,830 |
| Immigrants | Venezuela | 10.2 /100 | #213 | Poor $41,727 |
| Immigrants | Bangladesh | 10.1 /100 | #214 | Poor $41,709 |
| Sudanese | 9.9 /100 | #215 | Tragic $41,695 |
| Tongans | 9.9 /100 | #216 | Tragic $41,693 |