Iraqi vs Vietnamese Householder Income Under 25 years
COMPARE
Iraqi
Vietnamese
Householder Income Under 25 years
Householder Income Under 25 years Comparison
Iraqis
Vietnamese
$50,802
HOUSEHOLDER INCOME UNDER 25 YEARS
3.2/ 100
METRIC RATING
238th/ 347
METRIC RANK
$56,127
HOUSEHOLDER INCOME UNDER 25 YEARS
100.0/ 100
METRIC RATING
31st/ 347
METRIC RANK
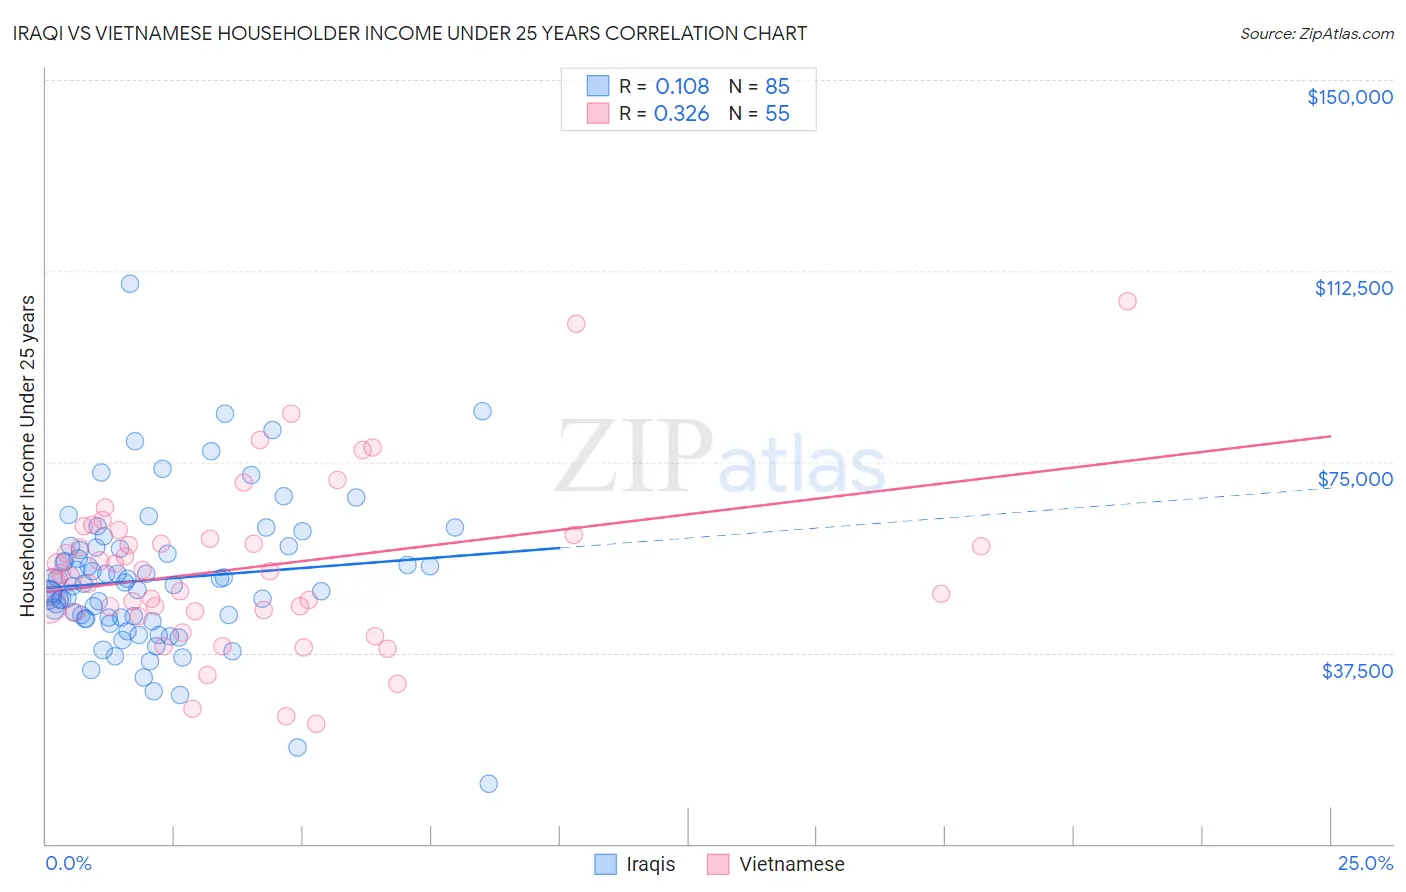
Iraqi vs Vietnamese Householder Income Under 25 years Correlation Chart
The statistical analysis conducted on geographies consisting of 156,411,431 people shows a poor positive correlation between the proportion of Iraqis and household income with householder under the age of 25 in the United States with a correlation coefficient (R) of 0.108 and weighted average of $50,802. Similarly, the statistical analysis conducted on geographies consisting of 155,350,861 people shows a mild positive correlation between the proportion of Vietnamese and household income with householder under the age of 25 in the United States with a correlation coefficient (R) of 0.326 and weighted average of $56,127, a difference of 10.5%.
Householder Income Under 25 years Correlation Summary
| Measurement | Iraqi | Vietnamese |
| Minimum | $11,835 | $23,560 |
| Maximum | $109,885 | $106,635 |
| Range | $98,050 | $83,075 |
| Mean | $51,943 | $54,213 |
| Median | $50,714 | $52,933 |
| Interquartile 25% (IQ1) | $44,189 | $45,658 |
| Interquartile 75% (IQ3) | $58,150 | $60,617 |
| Interquartile Range (IQR) | $13,961 | $14,959 |
| Standard Deviation (Sample) | $14,592 | $16,342 |
| Standard Deviation (Population) | $14,506 | $16,193 |
Similar Demographics by Householder Income Under 25 years
Demographics Similar to Iraqis by Householder Income Under 25 years
In terms of householder income under 25 years, the demographic groups most similar to Iraqis are German ($50,804, a difference of 0.0%), English ($50,805, a difference of 0.010%), Spanish ($50,813, a difference of 0.020%), Kenyan ($50,815, a difference of 0.030%), and Immigrants from Caribbean ($50,757, a difference of 0.090%).
| Demographics | Rating | Rank | Householder Income Under 25 years |
| Ugandans | 4.3 /100 | #231 | Tragic $50,923 |
| Slovenes | 4.0 /100 | #232 | Tragic $50,886 |
| Pennsylvania Germans | 3.7 /100 | #233 | Tragic $50,852 |
| Kenyans | 3.3 /100 | #234 | Tragic $50,815 |
| Spanish | 3.3 /100 | #235 | Tragic $50,813 |
| English | 3.3 /100 | #236 | Tragic $50,805 |
| Germans | 3.3 /100 | #237 | Tragic $50,804 |
| Iraqis | 3.2 /100 | #238 | Tragic $50,802 |
| Immigrants | Caribbean | 2.9 /100 | #239 | Tragic $50,757 |
| Immigrants | Lebanon | 2.7 /100 | #240 | Tragic $50,729 |
| Immigrants | Micronesia | 2.5 /100 | #241 | Tragic $50,691 |
| Cubans | 2.3 /100 | #242 | Tragic $50,655 |
| Immigrants | Thailand | 2.2 /100 | #243 | Tragic $50,645 |
| Marshallese | 2.1 /100 | #244 | Tragic $50,627 |
| Immigrants | Africa | 2.0 /100 | #245 | Tragic $50,609 |
Demographics Similar to Vietnamese by Householder Income Under 25 years
In terms of householder income under 25 years, the demographic groups most similar to Vietnamese are Immigrants from Moldova ($56,168, a difference of 0.070%), Peruvian ($56,052, a difference of 0.13%), Inupiat ($55,935, a difference of 0.34%), Immigrants from Japan ($55,932, a difference of 0.35%), and Tlingit-Haida ($55,914, a difference of 0.38%).
| Demographics | Rating | Rank | Householder Income Under 25 years |
| Immigrants | Singapore | 100.0 /100 | #24 | Exceptional $56,835 |
| Immigrants | Pakistan | 100.0 /100 | #25 | Exceptional $56,789 |
| Immigrants | Australia | 100.0 /100 | #26 | Exceptional $56,660 |
| Immigrants | North Macedonia | 100.0 /100 | #27 | Exceptional $56,503 |
| Immigrants | Peru | 100.0 /100 | #28 | Exceptional $56,384 |
| Immigrants | Asia | 100.0 /100 | #29 | Exceptional $56,379 |
| Immigrants | Moldova | 100.0 /100 | #30 | Exceptional $56,168 |
| Vietnamese | 100.0 /100 | #31 | Exceptional $56,127 |
| Peruvians | 100.0 /100 | #32 | Exceptional $56,052 |
| Inupiat | 100.0 /100 | #33 | Exceptional $55,935 |
| Immigrants | Japan | 100.0 /100 | #34 | Exceptional $55,932 |
| Tlingit-Haida | 100.0 /100 | #35 | Exceptional $55,914 |
| Immigrants | Israel | 100.0 /100 | #36 | Exceptional $55,913 |
| Immigrants | Russia | 100.0 /100 | #37 | Exceptional $55,891 |
| Immigrants | Iran | 100.0 /100 | #38 | Exceptional $55,880 |