Iraqi vs Immigrants from Cambodia Householder Income Over 65 years
COMPARE
Iraqi
Immigrants from Cambodia
Householder Income Over 65 years
Householder Income Over 65 years Comparison
Iraqis
Immigrants from Cambodia
$60,466
HOUSEHOLDER INCOME OVER 65 YEARS
37.2/ 100
METRIC RATING
184th/ 347
METRIC RANK
$57,580
HOUSEHOLDER INCOME OVER 65 YEARS
2.8/ 100
METRIC RATING
230th/ 347
METRIC RANK
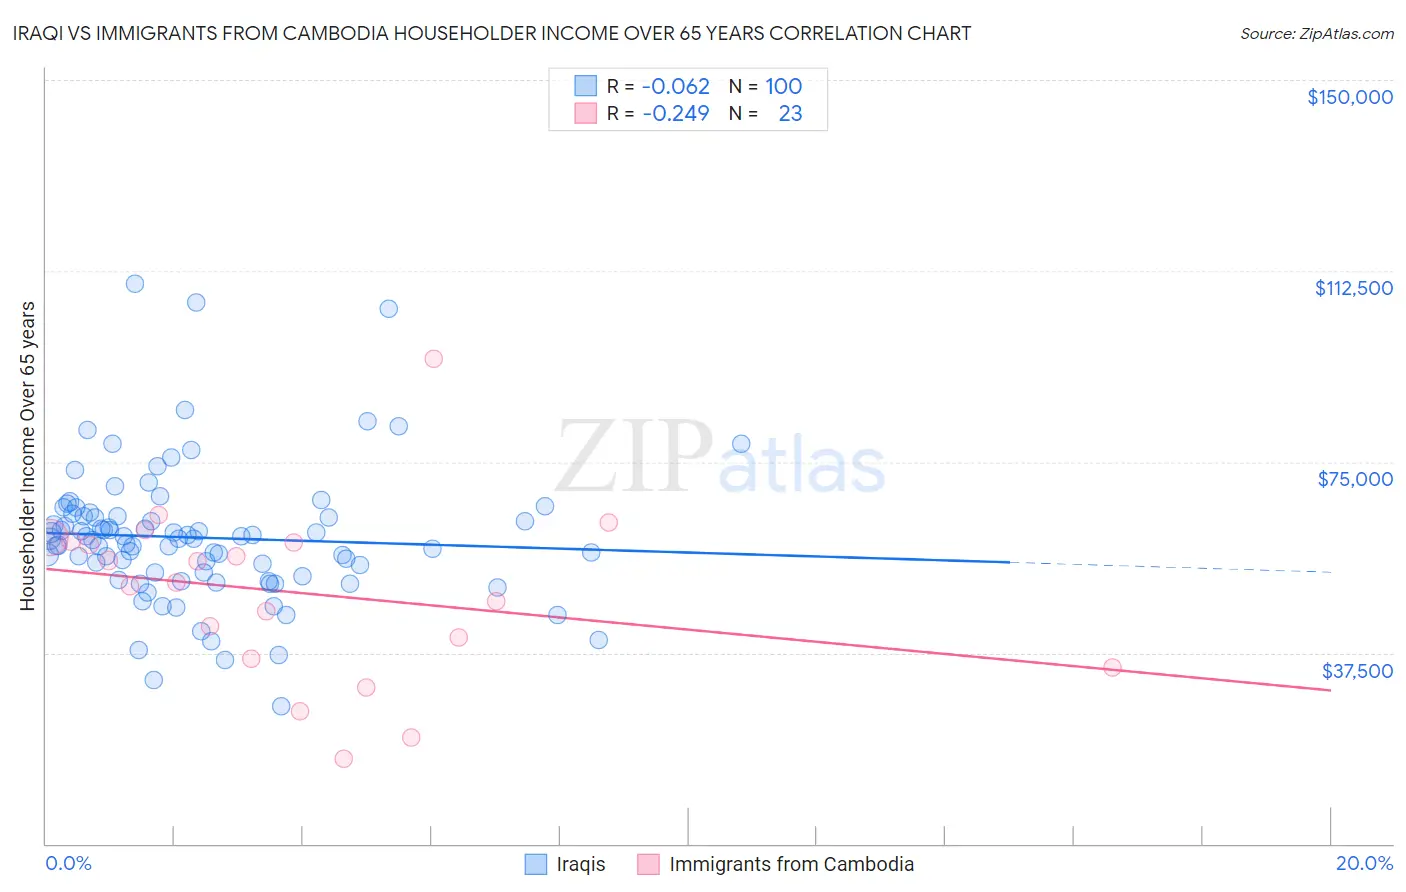
Iraqi vs Immigrants from Cambodia Householder Income Over 65 years Correlation Chart
The statistical analysis conducted on geographies consisting of 170,476,894 people shows a slight negative correlation between the proportion of Iraqis and household income with householder over the age of 65 in the United States with a correlation coefficient (R) of -0.062 and weighted average of $60,466. Similarly, the statistical analysis conducted on geographies consisting of 204,993,157 people shows a weak negative correlation between the proportion of Immigrants from Cambodia and household income with householder over the age of 65 in the United States with a correlation coefficient (R) of -0.249 and weighted average of $57,580, a difference of 5.0%.
Householder Income Over 65 years Correlation Summary
| Measurement | Iraqi | Immigrants from Cambodia |
| Minimum | $27,083 | $16,632 |
| Maximum | $110,088 | $95,250 |
| Range | $83,005 | $78,618 |
| Mean | $60,115 | $49,242 |
| Median | $59,854 | $51,420 |
| Interquartile 25% (IQ1) | $52,888 | $36,323 |
| Interquartile 75% (IQ3) | $64,237 | $59,381 |
| Interquartile Range (IQR) | $11,349 | $23,058 |
| Standard Deviation (Sample) | $13,499 | $17,189 |
| Standard Deviation (Population) | $13,432 | $16,811 |
Similar Demographics by Householder Income Over 65 years
Demographics Similar to Iraqis by Householder Income Over 65 years
In terms of householder income over 65 years, the demographic groups most similar to Iraqis are Kenyan ($60,514, a difference of 0.080%), Czechoslovakian ($60,581, a difference of 0.19%), Celtic ($60,608, a difference of 0.23%), Immigrants from Morocco ($60,647, a difference of 0.30%), and Welsh ($60,666, a difference of 0.33%).
| Demographics | Rating | Rank | Householder Income Over 65 years |
| Alaska Natives | 44.3 /100 | #177 | Average $60,748 |
| Yup'ik | 43.7 /100 | #178 | Average $60,727 |
| Welsh | 42.2 /100 | #179 | Average $60,666 |
| Immigrants | Morocco | 41.7 /100 | #180 | Average $60,647 |
| Celtics | 40.7 /100 | #181 | Average $60,608 |
| Czechoslovakians | 40.0 /100 | #182 | Average $60,581 |
| Kenyans | 38.4 /100 | #183 | Fair $60,514 |
| Iraqis | 37.2 /100 | #184 | Fair $60,466 |
| Albanians | 32.0 /100 | #185 | Fair $60,249 |
| Slovenes | 31.8 /100 | #186 | Fair $60,241 |
| Immigrants | Thailand | 31.3 /100 | #187 | Fair $60,217 |
| Immigrants | Eritrea | 28.6 /100 | #188 | Fair $60,096 |
| Ghanaians | 27.5 /100 | #189 | Fair $60,043 |
| Puget Sound Salish | 25.3 /100 | #190 | Fair $59,934 |
| Belgians | 24.9 /100 | #191 | Fair $59,915 |
Demographics Similar to Immigrants from Cambodia by Householder Income Over 65 years
In terms of householder income over 65 years, the demographic groups most similar to Immigrants from Cambodia are Immigrants from Colombia ($57,658, a difference of 0.14%), Nonimmigrants ($57,426, a difference of 0.27%), Immigrants from Venezuela ($57,371, a difference of 0.36%), Immigrants from Albania ($57,828, a difference of 0.43%), and Japanese ($57,919, a difference of 0.59%).
| Demographics | Rating | Rank | Householder Income Over 65 years |
| Tsimshian | 5.2 /100 | #223 | Tragic $58,202 |
| Bermudans | 5.1 /100 | #224 | Tragic $58,171 |
| Venezuelans | 4.4 /100 | #225 | Tragic $58,026 |
| French Canadians | 4.2 /100 | #226 | Tragic $57,975 |
| Japanese | 3.9 /100 | #227 | Tragic $57,919 |
| Immigrants | Albania | 3.6 /100 | #228 | Tragic $57,828 |
| Immigrants | Colombia | 3.0 /100 | #229 | Tragic $57,658 |
| Immigrants | Cambodia | 2.8 /100 | #230 | Tragic $57,580 |
| Immigrants | Nonimmigrants | 2.4 /100 | #231 | Tragic $57,426 |
| Immigrants | Venezuela | 2.3 /100 | #232 | Tragic $57,371 |
| Immigrants | Western Africa | 1.7 /100 | #233 | Tragic $57,119 |
| Immigrants | Burma/Myanmar | 1.7 /100 | #234 | Tragic $57,114 |
| Spanish Americans | 1.6 /100 | #235 | Tragic $57,021 |
| Immigrants | Uruguay | 1.5 /100 | #236 | Tragic $56,975 |
| Immigrants | Panama | 1.5 /100 | #237 | Tragic $56,944 |