Iraqi vs French American Indian Median Female Earnings
COMPARE
Iraqi
French American Indian
Median Female Earnings
Median Female Earnings Comparison
Iraqis
French American Indians
$38,666
MEDIAN FEMALE EARNINGS
10.5/ 100
METRIC RATING
214th/ 347
METRIC RANK
$36,920
MEDIAN FEMALE EARNINGS
0.3/ 100
METRIC RATING
270th/ 347
METRIC RANK
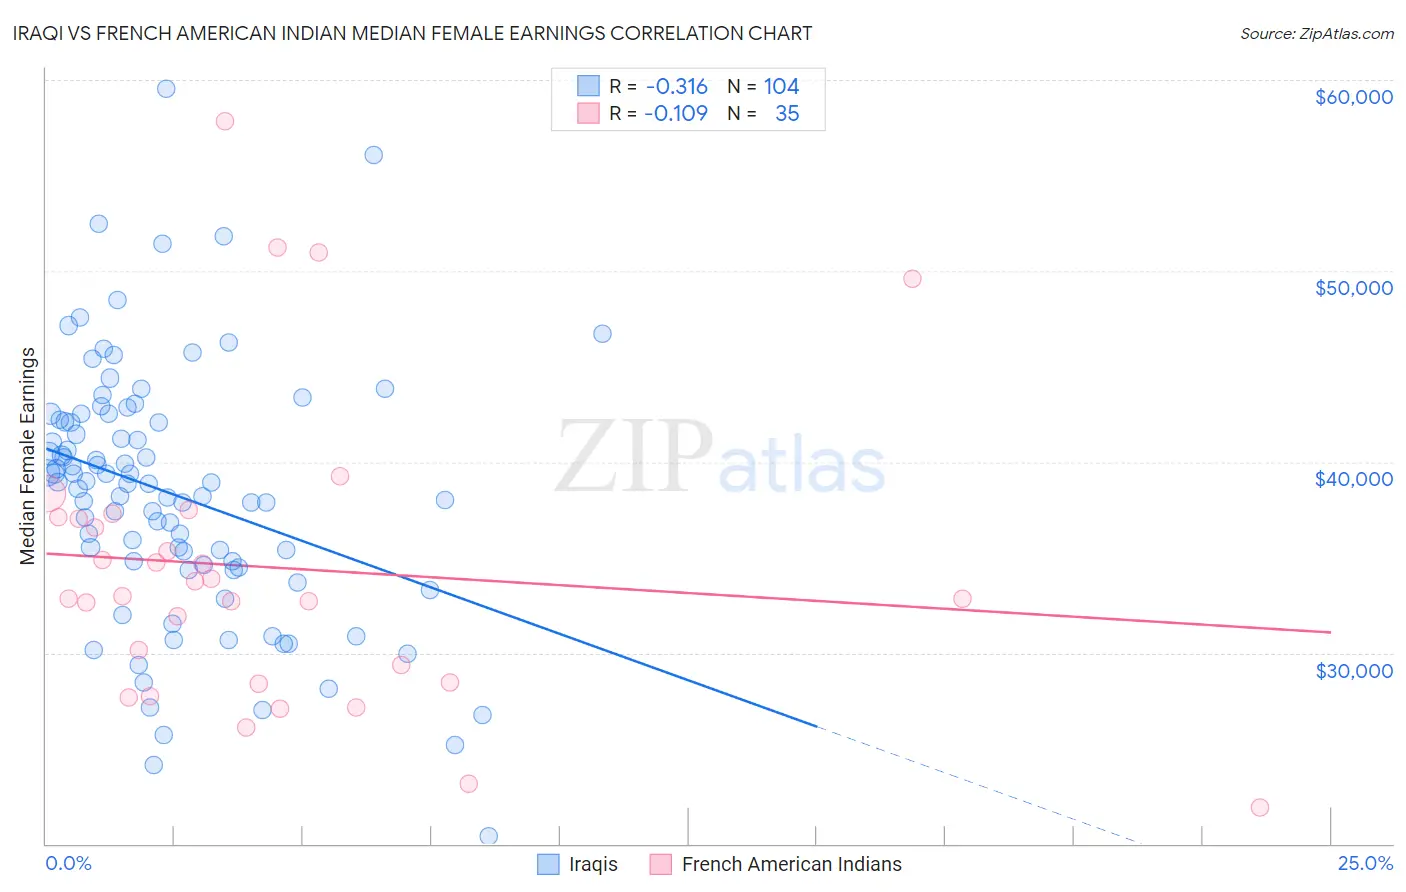
Iraqi vs French American Indian Median Female Earnings Correlation Chart
The statistical analysis conducted on geographies consisting of 170,627,853 people shows a mild negative correlation between the proportion of Iraqis and median female earnings in the United States with a correlation coefficient (R) of -0.316 and weighted average of $38,666. Similarly, the statistical analysis conducted on geographies consisting of 131,945,906 people shows a poor negative correlation between the proportion of French American Indians and median female earnings in the United States with a correlation coefficient (R) of -0.109 and weighted average of $36,920, a difference of 4.7%.
Median Female Earnings Correlation Summary
| Measurement | Iraqi | French American Indian |
| Minimum | $20,406 | $21,875 |
| Maximum | $59,566 | $57,813 |
| Range | $39,160 | $35,938 |
| Mean | $38,287 | $34,449 |
| Median | $38,841 | $32,961 |
| Interquartile 25% (IQ1) | $34,526 | $28,438 |
| Interquartile 75% (IQ3) | $42,153 | $37,095 |
| Interquartile Range (IQR) | $7,626 | $8,657 |
| Standard Deviation (Sample) | $6,723 | $7,858 |
| Standard Deviation (Population) | $6,691 | $7,745 |
Similar Demographics by Median Female Earnings
Demographics Similar to Iraqis by Median Female Earnings
In terms of median female earnings, the demographic groups most similar to Iraqis are Jamaican ($38,670, a difference of 0.010%), Spaniard ($38,656, a difference of 0.020%), Immigrants from Ecuador ($38,644, a difference of 0.060%), Immigrants from Jamaica ($38,625, a difference of 0.11%), and Guamanian/Chamorro ($38,717, a difference of 0.13%).
| Demographics | Rating | Rank | Median Female Earnings |
| Immigrants | Cambodia | 14.2 /100 | #207 | Poor $38,833 |
| Immigrants | Thailand | 13.6 /100 | #208 | Poor $38,810 |
| Norwegians | 13.4 /100 | #209 | Poor $38,802 |
| Czechoslovakians | 12.0 /100 | #210 | Poor $38,738 |
| Aleuts | 11.6 /100 | #211 | Poor $38,719 |
| Guamanians/Chamorros | 11.5 /100 | #212 | Poor $38,717 |
| Jamaicans | 10.5 /100 | #213 | Poor $38,670 |
| Iraqis | 10.5 /100 | #214 | Poor $38,666 |
| Spaniards | 10.3 /100 | #215 | Poor $38,656 |
| Immigrants | Ecuador | 10.1 /100 | #216 | Poor $38,644 |
| Immigrants | Jamaica | 9.7 /100 | #217 | Tragic $38,625 |
| Cape Verdeans | 9.5 /100 | #218 | Tragic $38,614 |
| Nepalese | 9.3 /100 | #219 | Tragic $38,603 |
| Yugoslavians | 8.8 /100 | #220 | Tragic $38,573 |
| Immigrants | Azores | 8.8 /100 | #221 | Tragic $38,573 |
Demographics Similar to French American Indians by Median Female Earnings
In terms of median female earnings, the demographic groups most similar to French American Indians are Nicaraguan ($36,904, a difference of 0.040%), Immigrants from Dominican Republic ($36,857, a difference of 0.17%), Immigrants from Laos ($36,841, a difference of 0.21%), Immigrants from Venezuela ($37,003, a difference of 0.23%), and Cree ($37,018, a difference of 0.27%).
| Demographics | Rating | Rank | Median Female Earnings |
| German Russians | 0.5 /100 | #263 | Tragic $37,105 |
| Salvadorans | 0.4 /100 | #264 | Tragic $37,083 |
| Immigrants | Belize | 0.4 /100 | #265 | Tragic $37,056 |
| Dominicans | 0.4 /100 | #266 | Tragic $37,046 |
| Immigrants | Nonimmigrants | 0.4 /100 | #267 | Tragic $37,024 |
| Cree | 0.4 /100 | #268 | Tragic $37,018 |
| Immigrants | Venezuela | 0.4 /100 | #269 | Tragic $37,003 |
| French American Indians | 0.3 /100 | #270 | Tragic $36,920 |
| Nicaraguans | 0.3 /100 | #271 | Tragic $36,904 |
| Immigrants | Dominican Republic | 0.3 /100 | #272 | Tragic $36,857 |
| Immigrants | Laos | 0.3 /100 | #273 | Tragic $36,841 |
| Immigrants | El Salvador | 0.2 /100 | #274 | Tragic $36,673 |
| Africans | 0.1 /100 | #275 | Tragic $36,530 |
| Central Americans | 0.1 /100 | #276 | Tragic $36,492 |
| Marshallese | 0.1 /100 | #277 | Tragic $36,459 |