Iraqi vs Cherokee Householder Income Ages 25 - 44 years
COMPARE
Iraqi
Cherokee
Householder Income Ages 25 - 44 years
Householder Income Ages 25 - 44 years Comparison
Iraqis
Cherokee
$90,764
HOUSEHOLDER INCOME AGES 25 - 44 YEARS
10.8/ 100
METRIC RATING
211th/ 347
METRIC RANK
$80,843
HOUSEHOLDER INCOME AGES 25 - 44 YEARS
0.0/ 100
METRIC RATING
300th/ 347
METRIC RANK
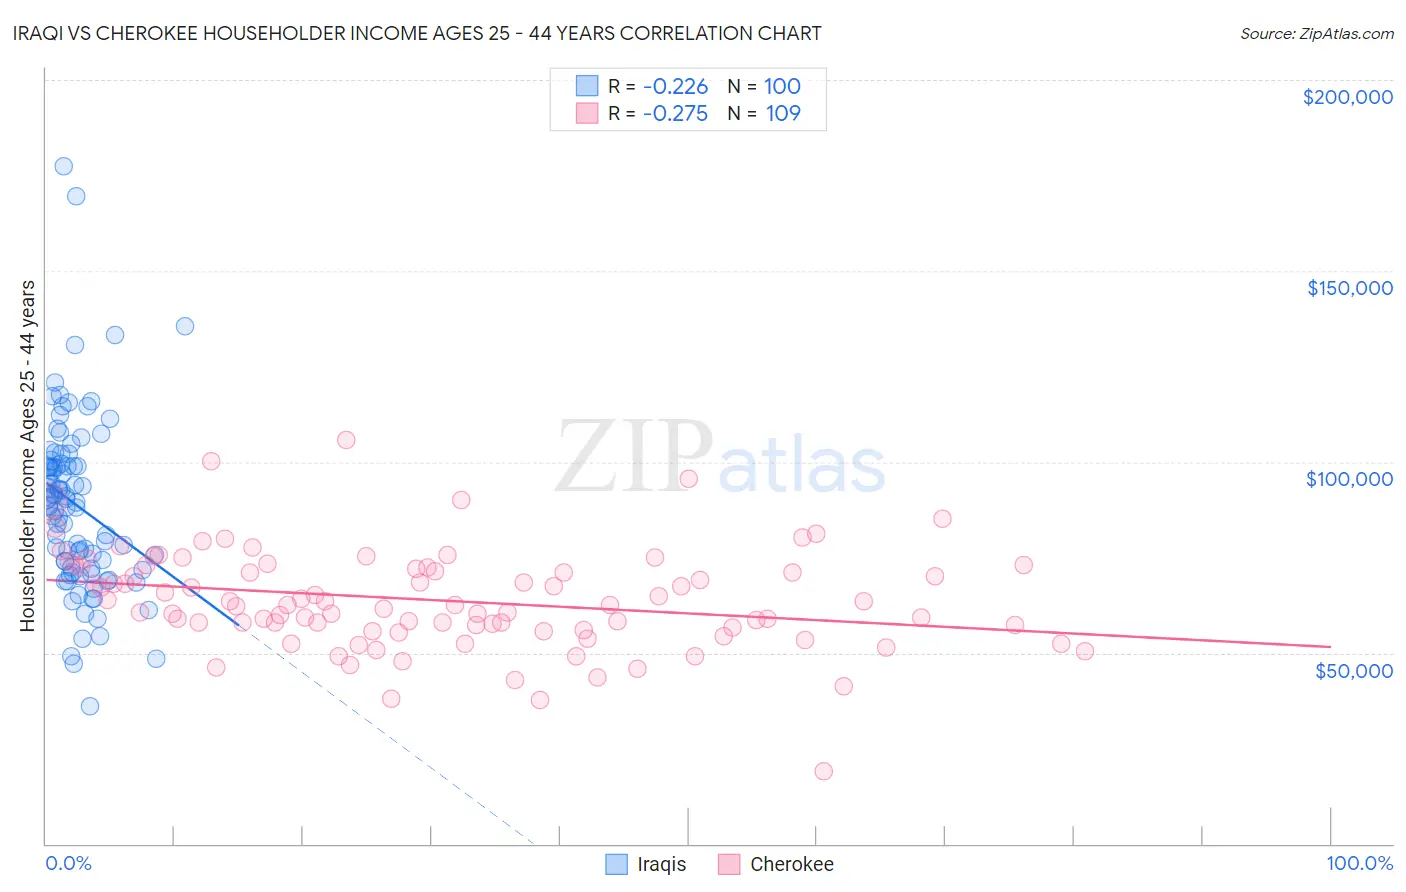
Iraqi vs Cherokee Householder Income Ages 25 - 44 years Correlation Chart
The statistical analysis conducted on geographies consisting of 170,561,402 people shows a weak negative correlation between the proportion of Iraqis and household income with householder between the ages 25 and 44 in the United States with a correlation coefficient (R) of -0.226 and weighted average of $90,764. Similarly, the statistical analysis conducted on geographies consisting of 490,925,760 people shows a weak negative correlation between the proportion of Cherokee and household income with householder between the ages 25 and 44 in the United States with a correlation coefficient (R) of -0.275 and weighted average of $80,843, a difference of 12.3%.
Householder Income Ages 25 - 44 years Correlation Summary
| Measurement | Iraqi | Cherokee |
| Minimum | $35,938 | $18,882 |
| Maximum | $177,567 | $105,572 |
| Range | $141,629 | $86,690 |
| Mean | $88,687 | $63,770 |
| Median | $88,906 | $62,500 |
| Interquartile 25% (IQ1) | $72,138 | $56,304 |
| Interquartile 75% (IQ3) | $99,186 | $72,426 |
| Interquartile Range (IQR) | $27,048 | $16,122 |
| Standard Deviation (Sample) | $23,025 | $13,175 |
| Standard Deviation (Population) | $22,910 | $13,114 |
Similar Demographics by Householder Income Ages 25 - 44 years
Demographics Similar to Iraqis by Householder Income Ages 25 - 44 years
In terms of householder income ages 25 - 44 years, the demographic groups most similar to Iraqis are Immigrants from Kenya ($90,767, a difference of 0.0%), Hawaiian ($90,722, a difference of 0.050%), Immigrants from Bangladesh ($90,448, a difference of 0.35%), Immigrants from Africa ($90,372, a difference of 0.43%), and Immigrants from Uruguay ($91,171, a difference of 0.45%).
| Demographics | Rating | Rank | Householder Income Ages 25 - 44 years |
| Nepalese | 15.4 /100 | #204 | Poor $91,498 |
| Immigrants | Eastern Africa | 15.2 /100 | #205 | Poor $91,458 |
| Aleuts | 14.5 /100 | #206 | Poor $91,370 |
| Yugoslavians | 14.5 /100 | #207 | Poor $91,368 |
| Immigrants | Thailand | 14.3 /100 | #208 | Poor $91,337 |
| Immigrants | Uruguay | 13.2 /100 | #209 | Poor $91,171 |
| Immigrants | Kenya | 10.9 /100 | #210 | Poor $90,767 |
| Iraqis | 10.8 /100 | #211 | Poor $90,764 |
| Hawaiians | 10.6 /100 | #212 | Poor $90,722 |
| Immigrants | Bangladesh | 9.3 /100 | #213 | Tragic $90,448 |
| Immigrants | Africa | 8.9 /100 | #214 | Tragic $90,372 |
| Panamanians | 8.1 /100 | #215 | Tragic $90,193 |
| Ghanaians | 7.9 /100 | #216 | Tragic $90,137 |
| Scotch-Irish | 7.3 /100 | #217 | Tragic $89,969 |
| Guyanese | 7.1 /100 | #218 | Tragic $89,940 |
Demographics Similar to Cherokee by Householder Income Ages 25 - 44 years
In terms of householder income ages 25 - 44 years, the demographic groups most similar to Cherokee are Immigrants from Liberia ($80,863, a difference of 0.020%), Immigrants from Micronesia ($80,544, a difference of 0.37%), Hispanic or Latino ($80,515, a difference of 0.41%), Dominican ($81,229, a difference of 0.48%), and Mexican ($80,427, a difference of 0.52%).
| Demographics | Rating | Rank | Householder Income Ages 25 - 44 years |
| Blackfeet | 0.1 /100 | #293 | Tragic $81,531 |
| Cubans | 0.1 /100 | #294 | Tragic $81,483 |
| Bangladeshis | 0.1 /100 | #295 | Tragic $81,363 |
| Immigrants | Dominica | 0.1 /100 | #296 | Tragic $81,351 |
| Immigrants | Guatemala | 0.1 /100 | #297 | Tragic $81,341 |
| Dominicans | 0.1 /100 | #298 | Tragic $81,229 |
| Immigrants | Liberia | 0.1 /100 | #299 | Tragic $80,863 |
| Cherokee | 0.0 /100 | #300 | Tragic $80,843 |
| Immigrants | Micronesia | 0.0 /100 | #301 | Tragic $80,544 |
| Hispanics or Latinos | 0.0 /100 | #302 | Tragic $80,515 |
| Mexicans | 0.0 /100 | #303 | Tragic $80,427 |
| Immigrants | Caribbean | 0.0 /100 | #304 | Tragic $80,326 |
| Immigrants | Dominican Republic | 0.0 /100 | #305 | Tragic $80,319 |
| Apache | 0.0 /100 | #306 | Tragic $80,260 |
| Haitians | 0.0 /100 | #307 | Tragic $80,055 |