Inupiat vs Immigrants from South Africa Householder Income Over 65 years
COMPARE
Inupiat
Immigrants from South Africa
Householder Income Over 65 years
Householder Income Over 65 years Comparison
Inupiat
Immigrants from South Africa
$61,061
HOUSEHOLDER INCOME OVER 65 YEARS
52.4/ 100
METRIC RATING
171st/ 347
METRIC RANK
$67,234
HOUSEHOLDER INCOME OVER 65 YEARS
99.9/ 100
METRIC RATING
44th/ 347
METRIC RANK
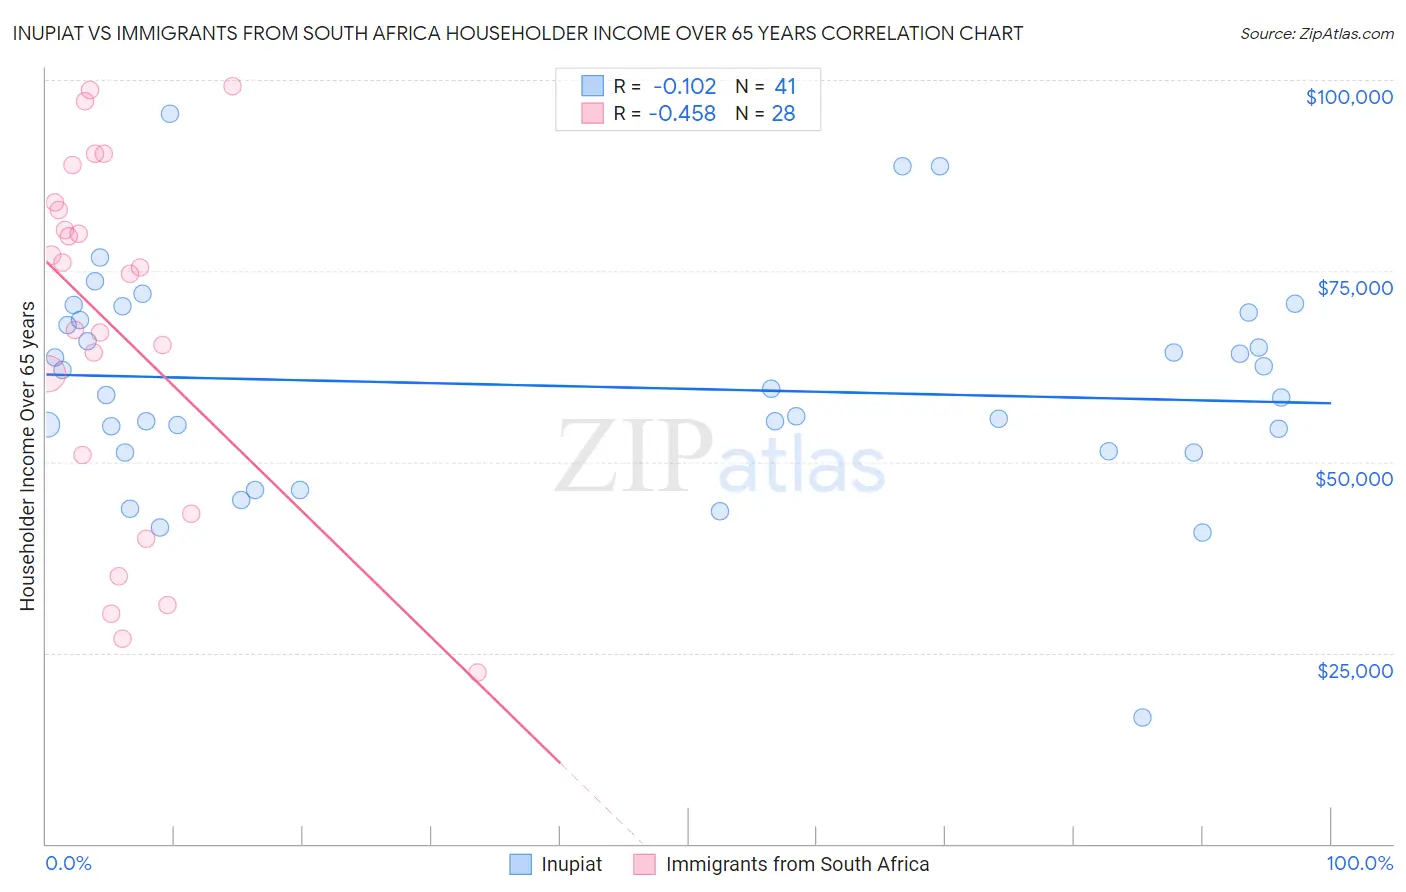
Inupiat vs Immigrants from South Africa Householder Income Over 65 years Correlation Chart
The statistical analysis conducted on geographies consisting of 96,206,206 people shows a poor negative correlation between the proportion of Inupiat and household income with householder over the age of 65 in the United States with a correlation coefficient (R) of -0.102 and weighted average of $61,061. Similarly, the statistical analysis conducted on geographies consisting of 232,954,007 people shows a moderate negative correlation between the proportion of Immigrants from South Africa and household income with householder over the age of 65 in the United States with a correlation coefficient (R) of -0.458 and weighted average of $67,234, a difference of 10.1%.
Householder Income Over 65 years Correlation Summary
| Measurement | Inupiat | Immigrants from South Africa |
| Minimum | $16,607 | $22,500 |
| Maximum | $95,647 | $99,125 |
| Range | $79,040 | $76,625 |
| Mean | $59,905 | $67,143 |
| Median | $58,687 | $74,972 |
| Interquartile 25% (IQ1) | $51,307 | $47,057 |
| Interquartile 75% (IQ3) | $69,101 | $83,529 |
| Interquartile Range (IQR) | $17,794 | $36,471 |
| Standard Deviation (Sample) | $14,461 | $23,355 |
| Standard Deviation (Population) | $14,284 | $22,935 |
Similar Demographics by Householder Income Over 65 years
Demographics Similar to Inupiat by Householder Income Over 65 years
In terms of householder income over 65 years, the demographic groups most similar to Inupiat are Immigrants from Poland ($61,041, a difference of 0.030%), Serbian ($61,087, a difference of 0.040%), Carpatho Rusyn ($61,093, a difference of 0.050%), Irish ($61,097, a difference of 0.060%), and Norwegian ($61,104, a difference of 0.070%).
| Demographics | Rating | Rank | Householder Income Over 65 years |
| Immigrants | North Macedonia | 55.4 /100 | #164 | Average $61,175 |
| Immigrants | Ukraine | 55.1 /100 | #165 | Average $61,163 |
| Immigrants | Eastern Africa | 55.0 /100 | #166 | Average $61,157 |
| Norwegians | 53.6 /100 | #167 | Average $61,104 |
| Irish | 53.4 /100 | #168 | Average $61,097 |
| Carpatho Rusyns | 53.3 /100 | #169 | Average $61,093 |
| Serbians | 53.1 /100 | #170 | Average $61,087 |
| Inupiat | 52.4 /100 | #171 | Average $61,061 |
| Immigrants | Poland | 51.9 /100 | #172 | Average $61,041 |
| Immigrants | Micronesia | 50.8 /100 | #173 | Average $61,000 |
| Luxembourgers | 50.0 /100 | #174 | Average $60,967 |
| Spaniards | 47.3 /100 | #175 | Average $60,866 |
| Spanish | 45.5 /100 | #176 | Average $60,795 |
| Alaska Natives | 44.3 /100 | #177 | Average $60,748 |
| Yup'ik | 43.7 /100 | #178 | Average $60,727 |
Demographics Similar to Immigrants from South Africa by Householder Income Over 65 years
In terms of householder income over 65 years, the demographic groups most similar to Immigrants from South Africa are Latvian ($67,326, a difference of 0.14%), New Zealander ($67,333, a difference of 0.15%), Immigrants from Afghanistan ($67,007, a difference of 0.34%), Korean ($67,472, a difference of 0.35%), and Cambodian ($66,892, a difference of 0.51%).
| Demographics | Rating | Rank | Householder Income Over 65 years |
| Turks | 99.9 /100 | #37 | Exceptional $68,037 |
| Estonians | 99.9 /100 | #38 | Exceptional $67,926 |
| Russians | 99.9 /100 | #39 | Exceptional $67,626 |
| Immigrants | Asia | 99.9 /100 | #40 | Exceptional $67,594 |
| Koreans | 99.9 /100 | #41 | Exceptional $67,472 |
| New Zealanders | 99.9 /100 | #42 | Exceptional $67,333 |
| Latvians | 99.9 /100 | #43 | Exceptional $67,326 |
| Immigrants | South Africa | 99.9 /100 | #44 | Exceptional $67,234 |
| Immigrants | Afghanistan | 99.8 /100 | #45 | Exceptional $67,007 |
| Cambodians | 99.8 /100 | #46 | Exceptional $66,892 |
| Australians | 99.8 /100 | #47 | Exceptional $66,891 |
| Immigrants | France | 99.8 /100 | #48 | Exceptional $66,826 |
| Immigrants | Indonesia | 99.8 /100 | #49 | Exceptional $66,694 |
| Immigrants | Turkey | 99.7 /100 | #50 | Exceptional $66,672 |
| Israelis | 99.7 /100 | #51 | Exceptional $66,636 |