Inupiat vs Asian Householder Income Ages 25 - 44 years
COMPARE
Inupiat
Asian
Householder Income Ages 25 - 44 years
Householder Income Ages 25 - 44 years Comparison
Inupiat
Asians
$84,619
HOUSEHOLDER INCOME AGES 25 - 44 YEARS
0.4/ 100
METRIC RATING
261st/ 347
METRIC RANK
$112,666
HOUSEHOLDER INCOME AGES 25 - 44 YEARS
100.0/ 100
METRIC RATING
21st/ 347
METRIC RANK
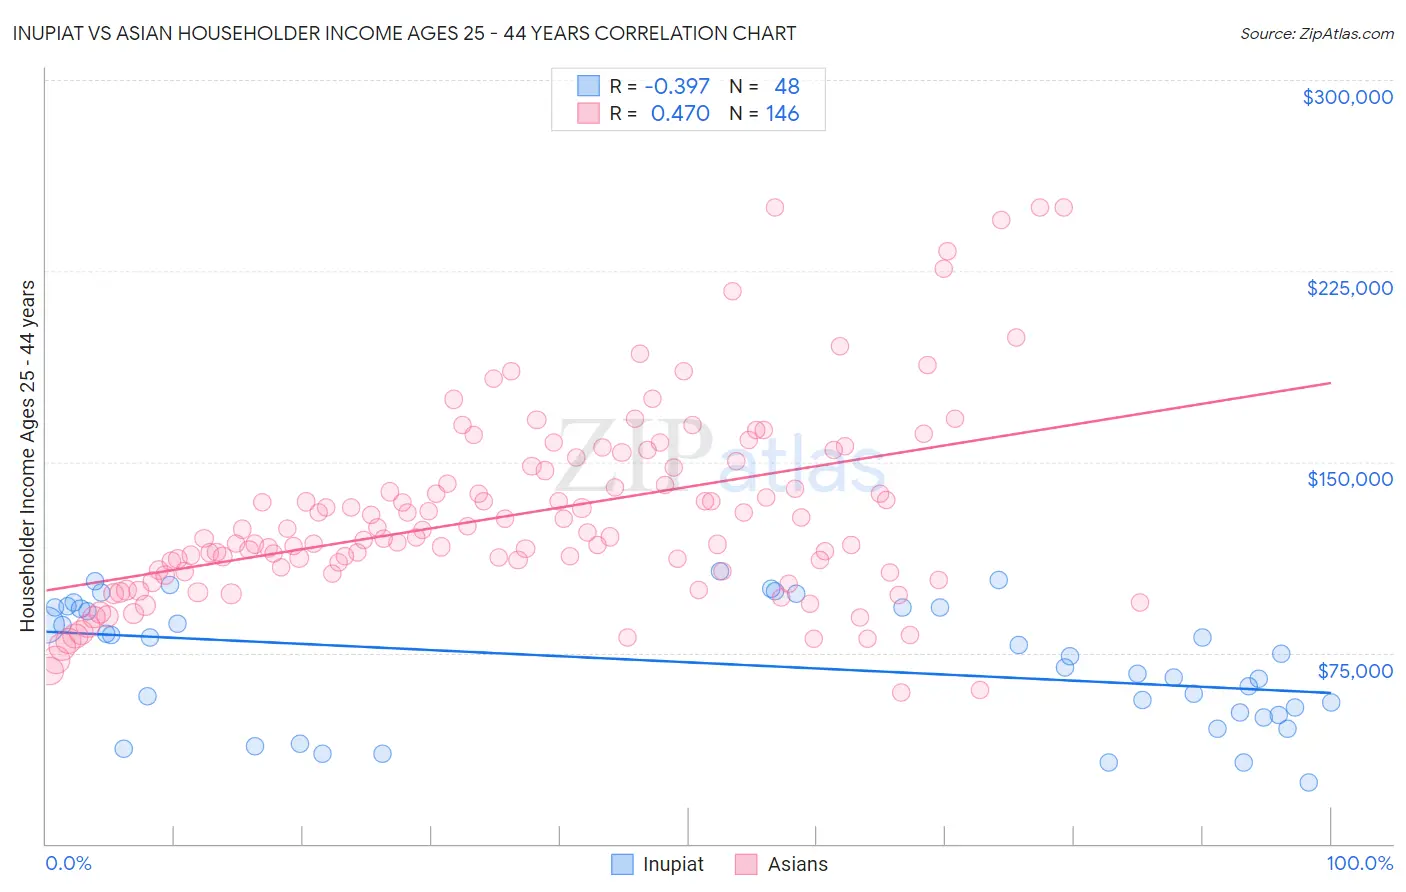
Inupiat vs Asian Householder Income Ages 25 - 44 years Correlation Chart
The statistical analysis conducted on geographies consisting of 96,221,283 people shows a mild negative correlation between the proportion of Inupiat and household income with householder between the ages 25 and 44 in the United States with a correlation coefficient (R) of -0.397 and weighted average of $84,619. Similarly, the statistical analysis conducted on geographies consisting of 547,125,697 people shows a moderate positive correlation between the proportion of Asians and household income with householder between the ages 25 and 44 in the United States with a correlation coefficient (R) of 0.470 and weighted average of $112,666, a difference of 33.2%.
Householder Income Ages 25 - 44 years Correlation Summary
| Measurement | Inupiat | Asian |
| Minimum | $24,167 | $59,230 |
| Maximum | $106,917 | $250,001 |
| Range | $82,750 | $190,771 |
| Mean | $70,828 | $129,468 |
| Median | $74,010 | $120,546 |
| Interquartile 25% (IQ1) | $51,032 | $106,801 |
| Interquartile 75% (IQ3) | $92,639 | $147,804 |
| Interquartile Range (IQR) | $41,608 | $41,004 |
| Standard Deviation (Sample) | $23,899 | $37,581 |
| Standard Deviation (Population) | $23,649 | $37,452 |
Similar Demographics by Householder Income Ages 25 - 44 years
Demographics Similar to Inupiat by Householder Income Ages 25 - 44 years
In terms of householder income ages 25 - 44 years, the demographic groups most similar to Inupiat are Cree ($84,574, a difference of 0.050%), Belizean ($84,534, a difference of 0.10%), Osage ($84,461, a difference of 0.19%), American ($84,791, a difference of 0.20%), and Sudanese ($84,401, a difference of 0.26%).
| Demographics | Rating | Rank | Householder Income Ages 25 - 44 years |
| Immigrants | Laos | 0.7 /100 | #254 | Tragic $85,553 |
| German Russians | 0.6 /100 | #255 | Tragic $85,220 |
| Central Americans | 0.5 /100 | #256 | Tragic $85,144 |
| Mexican American Indians | 0.5 /100 | #257 | Tragic $85,066 |
| Immigrants | Nicaragua | 0.5 /100 | #258 | Tragic $84,914 |
| Immigrants | Senegal | 0.5 /100 | #259 | Tragic $84,848 |
| Americans | 0.4 /100 | #260 | Tragic $84,791 |
| Inupiat | 0.4 /100 | #261 | Tragic $84,619 |
| Cree | 0.4 /100 | #262 | Tragic $84,574 |
| Belizeans | 0.4 /100 | #263 | Tragic $84,534 |
| Osage | 0.4 /100 | #264 | Tragic $84,461 |
| Sudanese | 0.4 /100 | #265 | Tragic $84,401 |
| Immigrants | Cabo Verde | 0.3 /100 | #266 | Tragic $84,304 |
| Hmong | 0.3 /100 | #267 | Tragic $84,258 |
| Sub-Saharan Africans | 0.3 /100 | #268 | Tragic $84,235 |
Demographics Similar to Asians by Householder Income Ages 25 - 44 years
In terms of householder income ages 25 - 44 years, the demographic groups most similar to Asians are Immigrants from Belgium ($112,575, a difference of 0.080%), Immigrants from Japan ($112,228, a difference of 0.39%), Immigrants from Sweden ($112,010, a difference of 0.59%), Immigrants from Korea ($113,401, a difference of 0.65%), and Immigrants from Northern Europe ($111,676, a difference of 0.89%).
| Demographics | Rating | Rank | Householder Income Ages 25 - 44 years |
| Immigrants | Israel | 100.0 /100 | #14 | Exceptional $117,219 |
| Immigrants | South Central Asia | 100.0 /100 | #15 | Exceptional $116,626 |
| Cypriots | 100.0 /100 | #16 | Exceptional $116,364 |
| Immigrants | Australia | 100.0 /100 | #17 | Exceptional $115,947 |
| Eastern Europeans | 100.0 /100 | #18 | Exceptional $114,523 |
| Burmese | 100.0 /100 | #19 | Exceptional $113,701 |
| Immigrants | Korea | 100.0 /100 | #20 | Exceptional $113,401 |
| Asians | 100.0 /100 | #21 | Exceptional $112,666 |
| Immigrants | Belgium | 100.0 /100 | #22 | Exceptional $112,575 |
| Immigrants | Japan | 100.0 /100 | #23 | Exceptional $112,228 |
| Immigrants | Sweden | 100.0 /100 | #24 | Exceptional $112,010 |
| Immigrants | Northern Europe | 100.0 /100 | #25 | Exceptional $111,676 |
| Immigrants | Asia | 100.0 /100 | #26 | Exceptional $110,787 |
| Russians | 100.0 /100 | #27 | Exceptional $110,398 |
| Immigrants | Denmark | 100.0 /100 | #28 | Exceptional $110,363 |