Indonesian vs Immigrants from Panama Median Earnings
COMPARE
Indonesian
Immigrants from Panama
Median Earnings
Median Earnings Comparison
Indonesians
Immigrants from Panama
$41,701
MEDIAN EARNINGS
0.1/ 100
METRIC RATING
287th/ 347
METRIC RANK
$45,198
MEDIAN EARNINGS
15.0/ 100
METRIC RATING
222nd/ 347
METRIC RANK
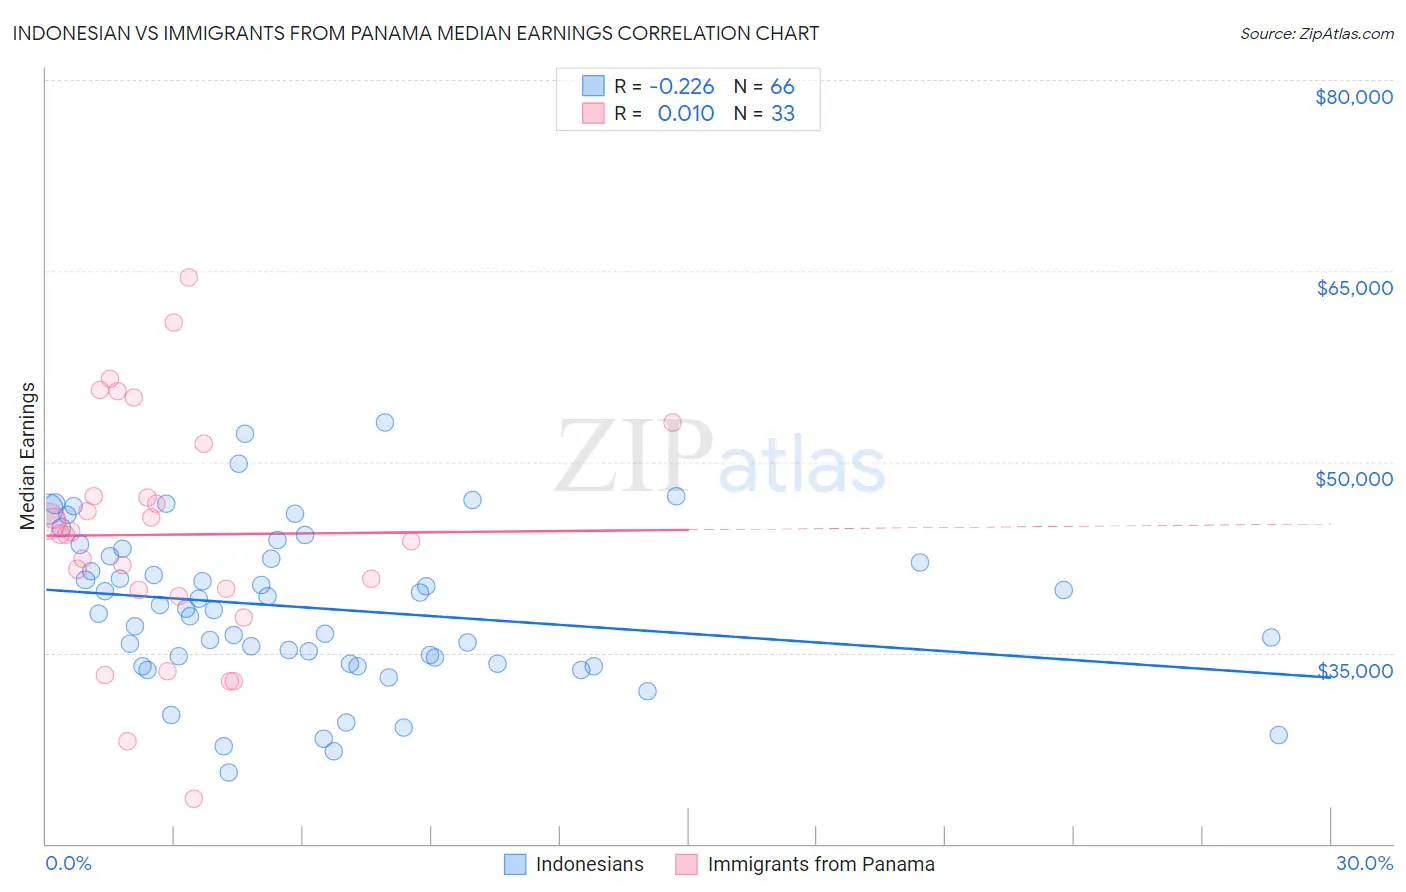
Indonesian vs Immigrants from Panama Median Earnings Correlation Chart
The statistical analysis conducted on geographies consisting of 162,738,870 people shows a weak negative correlation between the proportion of Indonesians and median earnings in the United States with a correlation coefficient (R) of -0.226 and weighted average of $41,701. Similarly, the statistical analysis conducted on geographies consisting of 221,169,853 people shows no correlation between the proportion of Immigrants from Panama and median earnings in the United States with a correlation coefficient (R) of 0.010 and weighted average of $45,198, a difference of 8.4%.
Median Earnings Correlation Summary
| Measurement | Indonesian | Immigrants from Panama |
| Minimum | $25,580 | $23,516 |
| Maximum | $53,125 | $64,519 |
| Range | $27,545 | $41,003 |
| Mean | $38,511 | $44,283 |
| Median | $38,377 | $44,355 |
| Interquartile 25% (IQ1) | $34,157 | $39,682 |
| Interquartile 75% (IQ3) | $42,572 | $49,375 |
| Interquartile Range (IQR) | $8,415 | $9,693 |
| Standard Deviation (Sample) | $6,165 | $9,181 |
| Standard Deviation (Population) | $6,119 | $9,041 |
Similar Demographics by Median Earnings
Demographics Similar to Indonesians by Median Earnings
In terms of median earnings, the demographic groups most similar to Indonesians are Mexican American Indian ($41,719, a difference of 0.040%), Immigrants from Nicaragua ($41,737, a difference of 0.090%), Blackfeet ($41,822, a difference of 0.29%), Immigrants from Dominican Republic ($41,554, a difference of 0.35%), and Dominican ($41,864, a difference of 0.39%).
| Demographics | Rating | Rank | Median Earnings |
| Hmong | 0.2 /100 | #280 | Tragic $42,111 |
| Marshallese | 0.2 /100 | #281 | Tragic $41,969 |
| Africans | 0.2 /100 | #282 | Tragic $41,955 |
| Dominicans | 0.2 /100 | #283 | Tragic $41,864 |
| Blackfeet | 0.2 /100 | #284 | Tragic $41,822 |
| Immigrants | Nicaragua | 0.1 /100 | #285 | Tragic $41,737 |
| Mexican American Indians | 0.1 /100 | #286 | Tragic $41,719 |
| Indonesians | 0.1 /100 | #287 | Tragic $41,701 |
| Immigrants | Dominican Republic | 0.1 /100 | #288 | Tragic $41,554 |
| Comanche | 0.1 /100 | #289 | Tragic $41,519 |
| Paiute | 0.1 /100 | #290 | Tragic $41,508 |
| Central American Indians | 0.1 /100 | #291 | Tragic $41,474 |
| U.S. Virgin Islanders | 0.1 /100 | #292 | Tragic $41,448 |
| Immigrants | Zaire | 0.1 /100 | #293 | Tragic $41,325 |
| Potawatomi | 0.1 /100 | #294 | Tragic $41,288 |
Demographics Similar to Immigrants from Panama by Median Earnings
In terms of median earnings, the demographic groups most similar to Immigrants from Panama are White/Caucasian ($45,197, a difference of 0.0%), Immigrants from Guyana ($45,204, a difference of 0.010%), Ecuadorian ($45,214, a difference of 0.030%), West Indian ($45,132, a difference of 0.15%), and Immigrants from Cambodia ($45,090, a difference of 0.24%).
| Demographics | Rating | Rank | Median Earnings |
| Immigrants | Bangladesh | 22.0 /100 | #215 | Fair $45,532 |
| Guyanese | 20.6 /100 | #216 | Fair $45,470 |
| Tlingit-Haida | 20.5 /100 | #217 | Fair $45,468 |
| Spanish | 19.7 /100 | #218 | Poor $45,432 |
| Dutch | 18.4 /100 | #219 | Poor $45,370 |
| Ecuadorians | 15.3 /100 | #220 | Poor $45,214 |
| Immigrants | Guyana | 15.1 /100 | #221 | Poor $45,204 |
| Immigrants | Panama | 15.0 /100 | #222 | Poor $45,198 |
| Whites/Caucasians | 15.0 /100 | #223 | Poor $45,197 |
| West Indians | 13.9 /100 | #224 | Poor $45,132 |
| Immigrants | Cambodia | 13.2 /100 | #225 | Poor $45,090 |
| Immigrants | Nigeria | 12.2 /100 | #226 | Poor $45,030 |
| Native Hawaiians | 12.2 /100 | #227 | Poor $45,027 |
| Immigrants | Iraq | 11.6 /100 | #228 | Poor $44,988 |
| Scotch-Irish | 10.7 /100 | #229 | Poor $44,924 |