Indonesian vs Immigrants from Micronesia Per Capita Income
COMPARE
Indonesian
Immigrants from Micronesia
Per Capita Income
Per Capita Income Comparison
Indonesians
Immigrants from Micronesia
$37,300
PER CAPITA INCOME
0.1/ 100
METRIC RATING
296th/ 347
METRIC RANK
$37,464
PER CAPITA INCOME
0.1/ 100
METRIC RATING
292nd/ 347
METRIC RANK
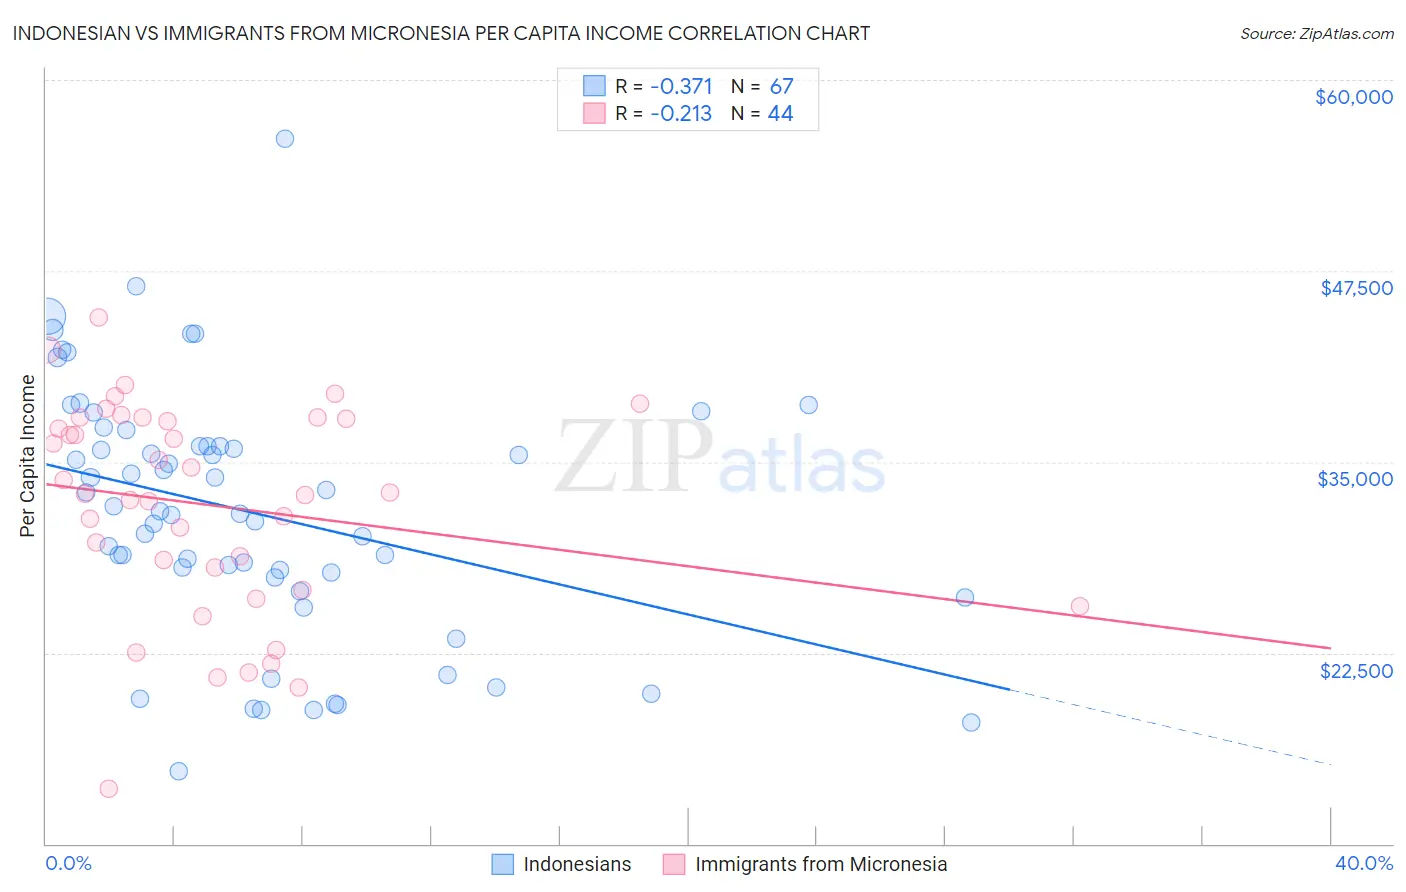
Indonesian vs Immigrants from Micronesia Per Capita Income Correlation Chart
The statistical analysis conducted on geographies consisting of 162,740,842 people shows a mild negative correlation between the proportion of Indonesians and per capita income in the United States with a correlation coefficient (R) of -0.371 and weighted average of $37,300. Similarly, the statistical analysis conducted on geographies consisting of 61,609,499 people shows a weak negative correlation between the proportion of Immigrants from Micronesia and per capita income in the United States with a correlation coefficient (R) of -0.213 and weighted average of $37,464, a difference of 0.44%.
Per Capita Income Correlation Summary
| Measurement | Indonesian | Immigrants from Micronesia |
| Minimum | $14,779 | $13,631 |
| Maximum | $56,163 | $44,421 |
| Range | $41,384 | $30,790 |
| Mean | $31,679 | $32,171 |
| Median | $31,763 | $32,971 |
| Interquartile 25% (IQ1) | $27,405 | $27,332 |
| Interquartile 75% (IQ3) | $36,017 | $37,862 |
| Interquartile Range (IQR) | $8,612 | $10,531 |
| Standard Deviation (Sample) | $8,209 | $6,923 |
| Standard Deviation (Population) | $8,147 | $6,844 |
Demographics Similar to Indonesians and Immigrants from Micronesia by Per Capita Income
In terms of per capita income, the demographic groups most similar to Indonesians are Immigrants from Dominican Republic ($37,306, a difference of 0.020%), Haitian ($37,289, a difference of 0.030%), Immigrants from Caribbean ($37,254, a difference of 0.12%), Cuban ($37,383, a difference of 0.22%), and Cherokee ($37,203, a difference of 0.26%). Similarly, the demographic groups most similar to Immigrants from Micronesia are Mexican American Indian ($37,407, a difference of 0.15%), Cajun ($37,527, a difference of 0.17%), Cuban ($37,383, a difference of 0.22%), Immigrants from Guatemala ($37,550, a difference of 0.23%), and U.S. Virgin Islander ($37,589, a difference of 0.33%).
| Demographics | Rating | Rank | Per Capita Income |
| Africans | 0.1 /100 | #284 | Tragic $37,785 |
| Guatemalans | 0.1 /100 | #285 | Tragic $37,766 |
| Central American Indians | 0.1 /100 | #286 | Tragic $37,699 |
| Dominicans | 0.1 /100 | #287 | Tragic $37,697 |
| Blackfeet | 0.1 /100 | #288 | Tragic $37,695 |
| U.S. Virgin Islanders | 0.1 /100 | #289 | Tragic $37,589 |
| Immigrants | Guatemala | 0.1 /100 | #290 | Tragic $37,550 |
| Cajuns | 0.1 /100 | #291 | Tragic $37,527 |
| Immigrants | Micronesia | 0.1 /100 | #292 | Tragic $37,464 |
| Mexican American Indians | 0.1 /100 | #293 | Tragic $37,407 |
| Cubans | 0.1 /100 | #294 | Tragic $37,383 |
| Immigrants | Dominican Republic | 0.1 /100 | #295 | Tragic $37,306 |
| Indonesians | 0.1 /100 | #296 | Tragic $37,300 |
| Haitians | 0.1 /100 | #297 | Tragic $37,289 |
| Immigrants | Caribbean | 0.1 /100 | #298 | Tragic $37,254 |
| Cherokee | 0.1 /100 | #299 | Tragic $37,203 |
| Immigrants | Bahamas | 0.1 /100 | #300 | Tragic $37,193 |
| Ottawa | 0.1 /100 | #301 | Tragic $37,101 |
| Shoshone | 0.1 /100 | #302 | Tragic $37,072 |
| Paiute | 0.1 /100 | #303 | Tragic $37,066 |
| Hondurans | 0.1 /100 | #304 | Tragic $37,031 |