Indonesian vs African Median Household Income
COMPARE
Indonesian
African
Median Household Income
Median Household Income Comparison
Indonesians
Africans
$72,856
MEDIAN HOUSEHOLD INCOME
0.0/ 100
METRIC RATING
299th/ 347
METRIC RANK
$72,650
MEDIAN HOUSEHOLD INCOME
0.0/ 100
METRIC RATING
303rd/ 347
METRIC RANK
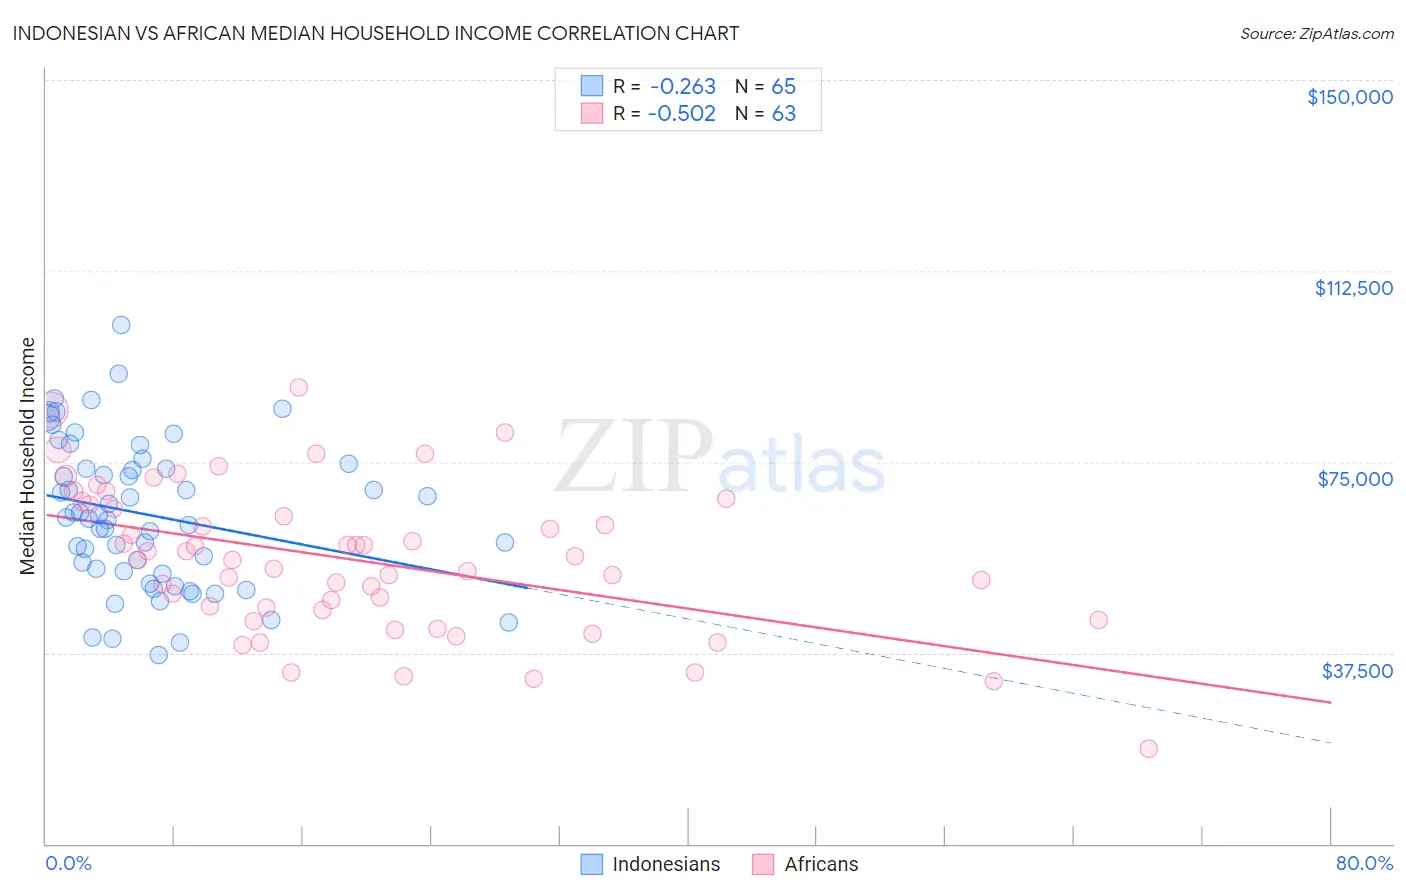
Indonesian vs African Median Household Income Correlation Chart
The statistical analysis conducted on geographies consisting of 162,609,195 people shows a weak negative correlation between the proportion of Indonesians and median household income in the United States with a correlation coefficient (R) of -0.263 and weighted average of $72,856. Similarly, the statistical analysis conducted on geographies consisting of 469,417,783 people shows a substantial negative correlation between the proportion of Africans and median household income in the United States with a correlation coefficient (R) of -0.502 and weighted average of $72,650, a difference of 0.28%.
Median Household Income Correlation Summary
| Measurement | Indonesian | African |
| Minimum | $36,966 | $18,750 |
| Maximum | $101,767 | $89,652 |
| Range | $64,801 | $70,902 |
| Mean | $64,599 | $55,711 |
| Median | $64,081 | $55,621 |
| Interquartile 25% (IQ1) | $53,194 | $45,960 |
| Interquartile 75% (IQ3) | $74,214 | $66,633 |
| Interquartile Range (IQR) | $21,021 | $20,673 |
| Standard Deviation (Sample) | $14,432 | $14,453 |
| Standard Deviation (Population) | $14,321 | $14,338 |
Demographics Similar to Indonesians and Africans by Median Household Income
In terms of median household income, the demographic groups most similar to Indonesians are Immigrants from Dominica ($72,760, a difference of 0.13%), Paiute ($72,959, a difference of 0.14%), Cherokee ($72,682, a difference of 0.24%), Shoshone ($72,660, a difference of 0.27%), and Immigrants from Haiti ($72,599, a difference of 0.35%). Similarly, the demographic groups most similar to Africans are Shoshone ($72,660, a difference of 0.010%), Cherokee ($72,682, a difference of 0.040%), Immigrants from Haiti ($72,599, a difference of 0.070%), Honduran ($72,588, a difference of 0.090%), and Potawatomi ($72,576, a difference of 0.10%).
| Demographics | Rating | Rank | Median Household Income |
| Hispanics or Latinos | 0.1 /100 | #291 | Tragic $73,823 |
| Comanche | 0.1 /100 | #292 | Tragic $73,747 |
| Immigrants | Cabo Verde | 0.1 /100 | #293 | Tragic $73,515 |
| Blackfeet | 0.1 /100 | #294 | Tragic $73,509 |
| Cubans | 0.1 /100 | #295 | Tragic $73,392 |
| Haitians | 0.1 /100 | #296 | Tragic $73,306 |
| Immigrants | Mexico | 0.0 /100 | #297 | Tragic $73,160 |
| Paiute | 0.0 /100 | #298 | Tragic $72,959 |
| Indonesians | 0.0 /100 | #299 | Tragic $72,856 |
| Immigrants | Dominica | 0.0 /100 | #300 | Tragic $72,760 |
| Cherokee | 0.0 /100 | #301 | Tragic $72,682 |
| Shoshone | 0.0 /100 | #302 | Tragic $72,660 |
| Africans | 0.0 /100 | #303 | Tragic $72,650 |
| Immigrants | Haiti | 0.0 /100 | #304 | Tragic $72,599 |
| Hondurans | 0.0 /100 | #305 | Tragic $72,588 |
| Potawatomi | 0.0 /100 | #306 | Tragic $72,576 |
| Ute | 0.0 /100 | #307 | Tragic $72,402 |
| Yakama | 0.0 /100 | #308 | Tragic $72,225 |
| Immigrants | Caribbean | 0.0 /100 | #309 | Tragic $71,860 |
| U.S. Virgin Islanders | 0.0 /100 | #310 | Tragic $71,853 |
| Immigrants | Zaire | 0.0 /100 | #311 | Tragic $71,801 |