Indian (Asian) vs Pennsylvania German Householder Income Under 25 years
COMPARE
Indian (Asian)
Pennsylvania German
Householder Income Under 25 years
Householder Income Under 25 years Comparison
Indians (Asian)
Pennsylvania Germans
$58,239
HOUSEHOLDER INCOME UNDER 25 YEARS
100.0/ 100
METRIC RATING
8th/ 347
METRIC RANK
$50,852
HOUSEHOLDER INCOME UNDER 25 YEARS
3.7/ 100
METRIC RATING
233rd/ 347
METRIC RANK
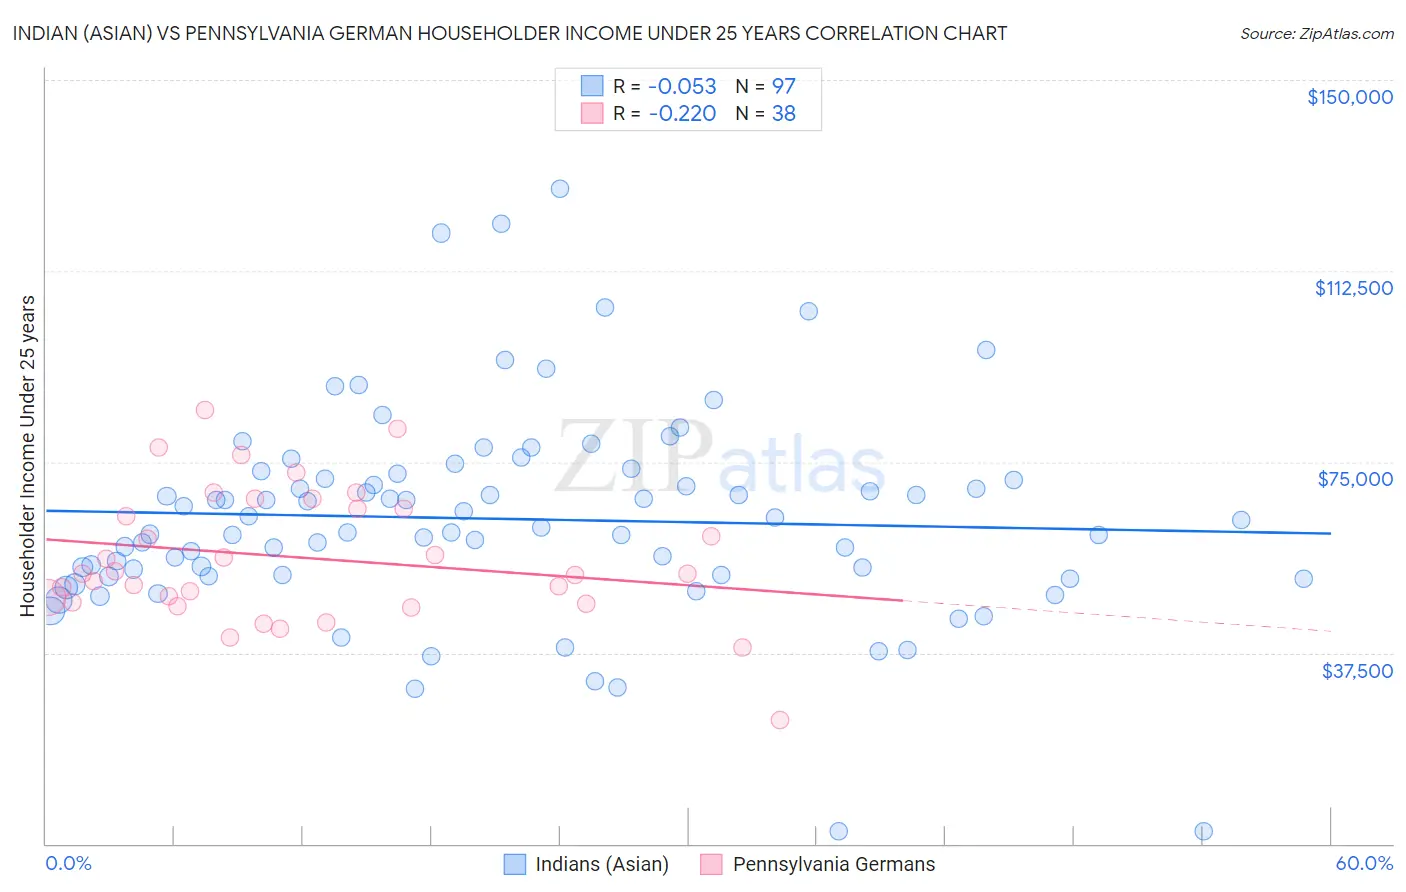
Indian (Asian) vs Pennsylvania German Householder Income Under 25 years Correlation Chart
The statistical analysis conducted on geographies consisting of 402,539,075 people shows a slight negative correlation between the proportion of Indians (Asian) and household income with householder under the age of 25 in the United States with a correlation coefficient (R) of -0.053 and weighted average of $58,239. Similarly, the statistical analysis conducted on geographies consisting of 205,538,034 people shows a weak negative correlation between the proportion of Pennsylvania Germans and household income with householder under the age of 25 in the United States with a correlation coefficient (R) of -0.220 and weighted average of $50,852, a difference of 14.5%.
Householder Income Under 25 years Correlation Summary
| Measurement | Indian (Asian) | Pennsylvania German |
| Minimum | $2,499 | $24,348 |
| Maximum | $128,558 | $85,269 |
| Range | $126,059 | $60,921 |
| Mean | $63,818 | $56,167 |
| Median | $62,127 | $53,030 |
| Interquartile 25% (IQ1) | $52,606 | $47,312 |
| Interquartile 75% (IQ3) | $72,136 | $65,833 |
| Interquartile Range (IQR) | $19,530 | $18,521 |
| Standard Deviation (Sample) | $20,459 | $13,051 |
| Standard Deviation (Population) | $20,353 | $12,878 |
Similar Demographics by Householder Income Under 25 years
Demographics Similar to Indians (Asian) by Householder Income Under 25 years
In terms of householder income under 25 years, the demographic groups most similar to Indians (Asian) are Chinese ($58,162, a difference of 0.13%), Afghan ($58,019, a difference of 0.38%), Bolivian ($58,506, a difference of 0.46%), Immigrants from China ($57,931, a difference of 0.53%), and Immigrants from Philippines ($57,930, a difference of 0.53%).
| Demographics | Rating | Rank | Householder Income Under 25 years |
| Assyrians/Chaldeans/Syriacs | 100.0 /100 | #1 | Exceptional $65,329 |
| Immigrants | Hong Kong | 100.0 /100 | #2 | Exceptional $62,083 |
| Immigrants | India | 100.0 /100 | #3 | Exceptional $59,914 |
| Immigrants | Taiwan | 100.0 /100 | #4 | Exceptional $59,424 |
| Immigrants | Bolivia | 100.0 /100 | #5 | Exceptional $59,389 |
| Thais | 100.0 /100 | #6 | Exceptional $59,187 |
| Bolivians | 100.0 /100 | #7 | Exceptional $58,506 |
| Indians (Asian) | 100.0 /100 | #8 | Exceptional $58,239 |
| Chinese | 100.0 /100 | #9 | Exceptional $58,162 |
| Afghans | 100.0 /100 | #10 | Exceptional $58,019 |
| Immigrants | China | 100.0 /100 | #11 | Exceptional $57,931 |
| Immigrants | Philippines | 100.0 /100 | #12 | Exceptional $57,930 |
| Immigrants | South Central Asia | 100.0 /100 | #13 | Exceptional $57,818 |
| Filipinos | 100.0 /100 | #14 | Exceptional $57,740 |
| Koreans | 100.0 /100 | #15 | Exceptional $57,730 |
Demographics Similar to Pennsylvania Germans by Householder Income Under 25 years
In terms of householder income under 25 years, the demographic groups most similar to Pennsylvania Germans are Slovene ($50,886, a difference of 0.070%), Kenyan ($50,815, a difference of 0.070%), Spanish ($50,813, a difference of 0.080%), English ($50,805, a difference of 0.090%), and German ($50,804, a difference of 0.090%).
| Demographics | Rating | Rank | Householder Income Under 25 years |
| Yugoslavians | 5.5 /100 | #226 | Tragic $51,028 |
| Immigrants | Central America | 5.4 /100 | #227 | Tragic $51,022 |
| Immigrants | Norway | 5.0 /100 | #228 | Tragic $50,984 |
| Yuman | 4.4 /100 | #229 | Tragic $50,933 |
| Jamaicans | 4.4 /100 | #230 | Tragic $50,929 |
| Ugandans | 4.3 /100 | #231 | Tragic $50,923 |
| Slovenes | 4.0 /100 | #232 | Tragic $50,886 |
| Pennsylvania Germans | 3.7 /100 | #233 | Tragic $50,852 |
| Kenyans | 3.3 /100 | #234 | Tragic $50,815 |
| Spanish | 3.3 /100 | #235 | Tragic $50,813 |
| English | 3.3 /100 | #236 | Tragic $50,805 |
| Germans | 3.3 /100 | #237 | Tragic $50,804 |
| Iraqis | 3.2 /100 | #238 | Tragic $50,802 |
| Immigrants | Caribbean | 2.9 /100 | #239 | Tragic $50,757 |
| Immigrants | Lebanon | 2.7 /100 | #240 | Tragic $50,729 |