Indian (Asian) vs Laotian Median Household Income
COMPARE
Indian (Asian)
Laotian
Median Household Income
Median Household Income Comparison
Indians (Asian)
Laotians
$105,262
MEDIAN HOUSEHOLD INCOME
100.0/ 100
METRIC RATING
12th/ 347
METRIC RANK
$94,990
MEDIAN HOUSEHOLD INCOME
99.8/ 100
METRIC RATING
61st/ 347
METRIC RANK
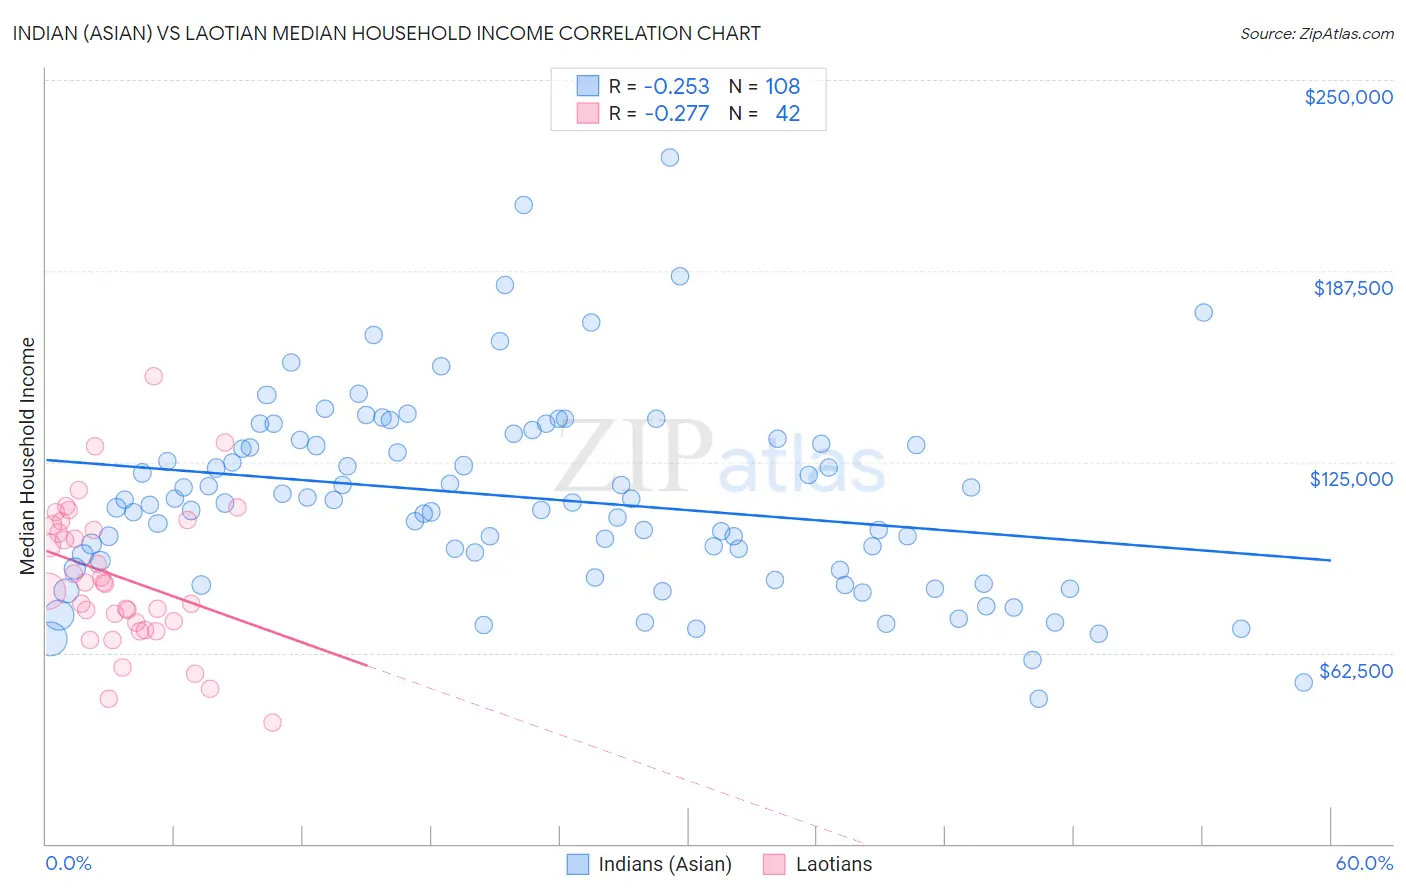
Indian (Asian) vs Laotian Median Household Income Correlation Chart
The statistical analysis conducted on geographies consisting of 494,532,621 people shows a weak negative correlation between the proportion of Indians (Asian) and median household income in the United States with a correlation coefficient (R) of -0.253 and weighted average of $105,262. Similarly, the statistical analysis conducted on geographies consisting of 224,713,642 people shows a weak negative correlation between the proportion of Laotians and median household income in the United States with a correlation coefficient (R) of -0.277 and weighted average of $94,990, a difference of 10.8%.
Median Household Income Correlation Summary
| Measurement | Indian (Asian) | Laotian |
| Minimum | $47,386 | $39,542 |
| Maximum | $224,427 | $153,021 |
| Range | $177,041 | $113,479 |
| Mean | $113,272 | $87,400 |
| Median | $111,615 | $85,171 |
| Interquartile 25% (IQ1) | $91,317 | $72,352 |
| Interquartile 75% (IQ3) | $131,580 | $104,389 |
| Interquartile Range (IQR) | $40,263 | $32,037 |
| Standard Deviation (Sample) | $31,514 | $23,584 |
| Standard Deviation (Population) | $31,368 | $23,302 |
Similar Demographics by Median Household Income
Demographics Similar to Indians (Asian) by Median Household Income
In terms of median household income, the demographic groups most similar to Indians (Asian) are Immigrants from China ($105,335, a difference of 0.070%), Immigrants from Eastern Asia ($104,796, a difference of 0.45%), Immigrants from Ireland ($104,692, a difference of 0.54%), Immigrants from South Central Asia ($106,057, a difference of 0.76%), and Immigrants from Israel ($104,090, a difference of 1.1%).
| Demographics | Rating | Rank | Median Household Income |
| Thais | 100.0 /100 | #5 | Exceptional $110,648 |
| Immigrants | Singapore | 100.0 /100 | #6 | Exceptional $110,428 |
| Iranians | 100.0 /100 | #7 | Exceptional $109,835 |
| Immigrants | Iran | 100.0 /100 | #8 | Exceptional $108,055 |
| Okinawans | 100.0 /100 | #9 | Exceptional $106,624 |
| Immigrants | South Central Asia | 100.0 /100 | #10 | Exceptional $106,057 |
| Immigrants | China | 100.0 /100 | #11 | Exceptional $105,335 |
| Indians (Asian) | 100.0 /100 | #12 | Exceptional $105,262 |
| Immigrants | Eastern Asia | 100.0 /100 | #13 | Exceptional $104,796 |
| Immigrants | Ireland | 100.0 /100 | #14 | Exceptional $104,692 |
| Immigrants | Israel | 100.0 /100 | #15 | Exceptional $104,090 |
| Burmese | 100.0 /100 | #16 | Exceptional $103,145 |
| Immigrants | Korea | 100.0 /100 | #17 | Exceptional $102,962 |
| Cypriots | 100.0 /100 | #18 | Exceptional $102,843 |
| Immigrants | Australia | 100.0 /100 | #19 | Exceptional $102,562 |
Demographics Similar to Laotians by Median Household Income
In terms of median household income, the demographic groups most similar to Laotians are Korean ($95,018, a difference of 0.030%), Immigrants from Europe ($95,032, a difference of 0.040%), Soviet Union ($95,098, a difference of 0.11%), Immigrants from Norway ($94,846, a difference of 0.15%), and New Zealander ($95,146, a difference of 0.16%).
| Demographics | Rating | Rank | Median Household Income |
| Egyptians | 99.9 /100 | #54 | Exceptional $95,673 |
| Immigrants | Czechoslovakia | 99.9 /100 | #55 | Exceptional $95,319 |
| Immigrants | Austria | 99.9 /100 | #56 | Exceptional $95,277 |
| New Zealanders | 99.8 /100 | #57 | Exceptional $95,146 |
| Soviet Union | 99.8 /100 | #58 | Exceptional $95,098 |
| Immigrants | Europe | 99.8 /100 | #59 | Exceptional $95,032 |
| Koreans | 99.8 /100 | #60 | Exceptional $95,018 |
| Laotians | 99.8 /100 | #61 | Exceptional $94,990 |
| Immigrants | Norway | 99.8 /100 | #62 | Exceptional $94,846 |
| Greeks | 99.8 /100 | #63 | Exceptional $94,735 |
| Immigrants | Netherlands | 99.7 /100 | #64 | Exceptional $94,411 |
| Immigrants | Belarus | 99.7 /100 | #65 | Exceptional $94,399 |
| Immigrants | Romania | 99.7 /100 | #66 | Exceptional $94,222 |
| Immigrants | Scotland | 99.7 /100 | #67 | Exceptional $94,091 |
| Mongolians | 99.7 /100 | #68 | Exceptional $93,971 |