Indian (Asian) vs Immigrants Median Male Earnings
COMPARE
Indian (Asian)
Immigrants
Median Male Earnings
Median Male Earnings Comparison
Indians (Asian)
Immigrants
$66,078
MEDIAN MALE EARNINGS
100.0/ 100
METRIC RATING
18th/ 347
METRIC RANK
$54,168
MEDIAN MALE EARNINGS
42.1/ 100
METRIC RATING
181st/ 347
METRIC RANK
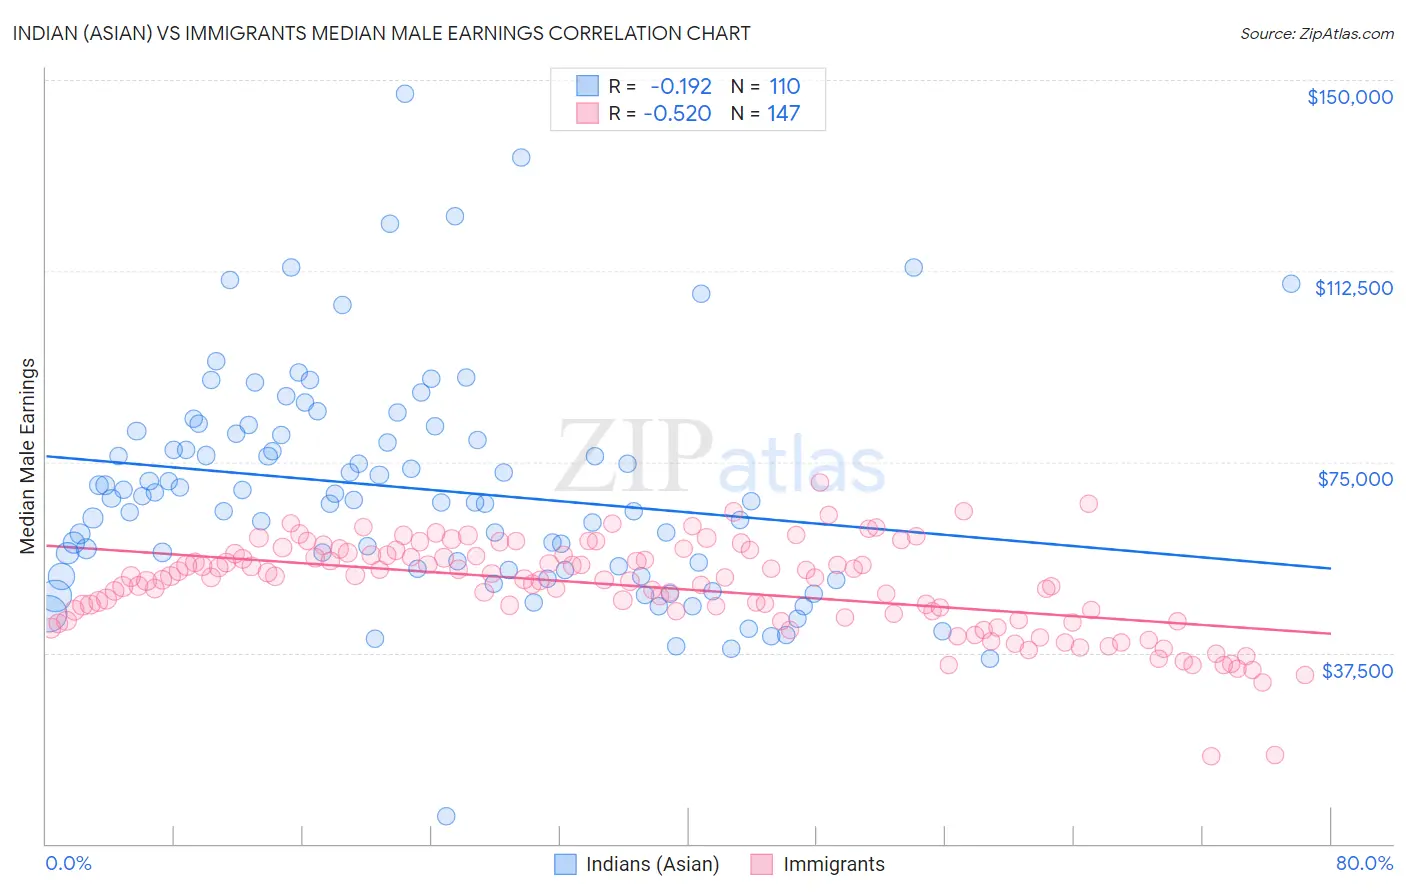
Indian (Asian) vs Immigrants Median Male Earnings Correlation Chart
The statistical analysis conducted on geographies consisting of 494,843,397 people shows a poor negative correlation between the proportion of Indians (Asian) and median male earnings in the United States with a correlation coefficient (R) of -0.192 and weighted average of $66,078. Similarly, the statistical analysis conducted on geographies consisting of 575,766,345 people shows a substantial negative correlation between the proportion of Immigrants and median male earnings in the United States with a correlation coefficient (R) of -0.520 and weighted average of $54,168, a difference of 22.0%.
Median Male Earnings Correlation Summary
| Measurement | Indian (Asian) | Immigrants |
| Minimum | $5,439 | $17,250 |
| Maximum | $147,267 | $71,068 |
| Range | $141,828 | $53,818 |
| Mean | $69,730 | $50,484 |
| Median | $67,689 | $52,327 |
| Interquartile 25% (IQ1) | $53,972 | $44,402 |
| Interquartile 75% (IQ3) | $80,584 | $56,800 |
| Interquartile Range (IQR) | $26,612 | $12,398 |
| Standard Deviation (Sample) | $22,146 | $9,155 |
| Standard Deviation (Population) | $22,045 | $9,124 |
Similar Demographics by Median Male Earnings
Demographics Similar to Indians (Asian) by Median Male Earnings
In terms of median male earnings, the demographic groups most similar to Indians (Asian) are Immigrants from Belgium ($66,125, a difference of 0.070%), Eastern European ($66,472, a difference of 0.60%), Cypriot ($65,549, a difference of 0.81%), Immigrants from Japan ($65,518, a difference of 0.85%), and Immigrants from Sweden ($65,406, a difference of 1.0%).
| Demographics | Rating | Rank | Median Male Earnings |
| Immigrants | Ireland | 100.0 /100 | #11 | Exceptional $67,698 |
| Immigrants | Australia | 100.0 /100 | #12 | Exceptional $67,634 |
| Immigrants | China | 100.0 /100 | #13 | Exceptional $67,353 |
| Okinawans | 100.0 /100 | #14 | Exceptional $67,232 |
| Immigrants | Eastern Asia | 100.0 /100 | #15 | Exceptional $66,903 |
| Eastern Europeans | 100.0 /100 | #16 | Exceptional $66,472 |
| Immigrants | Belgium | 100.0 /100 | #17 | Exceptional $66,125 |
| Indians (Asian) | 100.0 /100 | #18 | Exceptional $66,078 |
| Cypriots | 100.0 /100 | #19 | Exceptional $65,549 |
| Immigrants | Japan | 100.0 /100 | #20 | Exceptional $65,518 |
| Immigrants | Sweden | 100.0 /100 | #21 | Exceptional $65,406 |
| Burmese | 100.0 /100 | #22 | Exceptional $65,236 |
| Immigrants | Korea | 100.0 /100 | #23 | Exceptional $65,079 |
| Immigrants | Northern Europe | 100.0 /100 | #24 | Exceptional $64,987 |
| Immigrants | Denmark | 100.0 /100 | #25 | Exceptional $64,625 |
Demographics Similar to Immigrants by Median Male Earnings
In terms of median male earnings, the demographic groups most similar to Immigrants are Iraqi ($54,182, a difference of 0.030%), Celtic ($54,242, a difference of 0.14%), Costa Rican ($54,279, a difference of 0.21%), Sierra Leonean ($54,279, a difference of 0.21%), and Yugoslavian ($53,967, a difference of 0.37%).
| Demographics | Rating | Rank | Median Male Earnings |
| South Americans | 50.0 /100 | #174 | Average $54,492 |
| Dutch | 48.0 /100 | #175 | Average $54,410 |
| Spaniards | 47.8 /100 | #176 | Average $54,401 |
| Costa Ricans | 44.8 /100 | #177 | Average $54,279 |
| Sierra Leoneans | 44.8 /100 | #178 | Average $54,279 |
| Celtics | 43.9 /100 | #179 | Average $54,242 |
| Iraqis | 42.5 /100 | #180 | Average $54,182 |
| Immigrants | Immigrants | 42.1 /100 | #181 | Average $54,168 |
| Yugoslavians | 37.4 /100 | #182 | Fair $53,967 |
| Immigrants | South America | 37.3 /100 | #183 | Fair $53,962 |
| Whites/Caucasians | 36.5 /100 | #184 | Fair $53,925 |
| Immigrants | Sierra Leone | 36.0 /100 | #185 | Fair $53,905 |
| Colombians | 34.4 /100 | #186 | Fair $53,832 |
| Immigrants | Eritrea | 31.8 /100 | #187 | Fair $53,715 |
| Immigrants | Eastern Africa | 31.8 /100 | #188 | Fair $53,713 |