Immigrants vs Bermudan Householder Income Under 25 years
COMPARE
Immigrants
Bermudan
Householder Income Under 25 years
Householder Income Under 25 years Comparison
Immigrants
Bermudans
$53,201
HOUSEHOLDER INCOME UNDER 25 YEARS
92.2/ 100
METRIC RATING
133rd/ 347
METRIC RANK
$47,359
HOUSEHOLDER INCOME UNDER 25 YEARS
0.0/ 100
METRIC RATING
312th/ 347
METRIC RANK
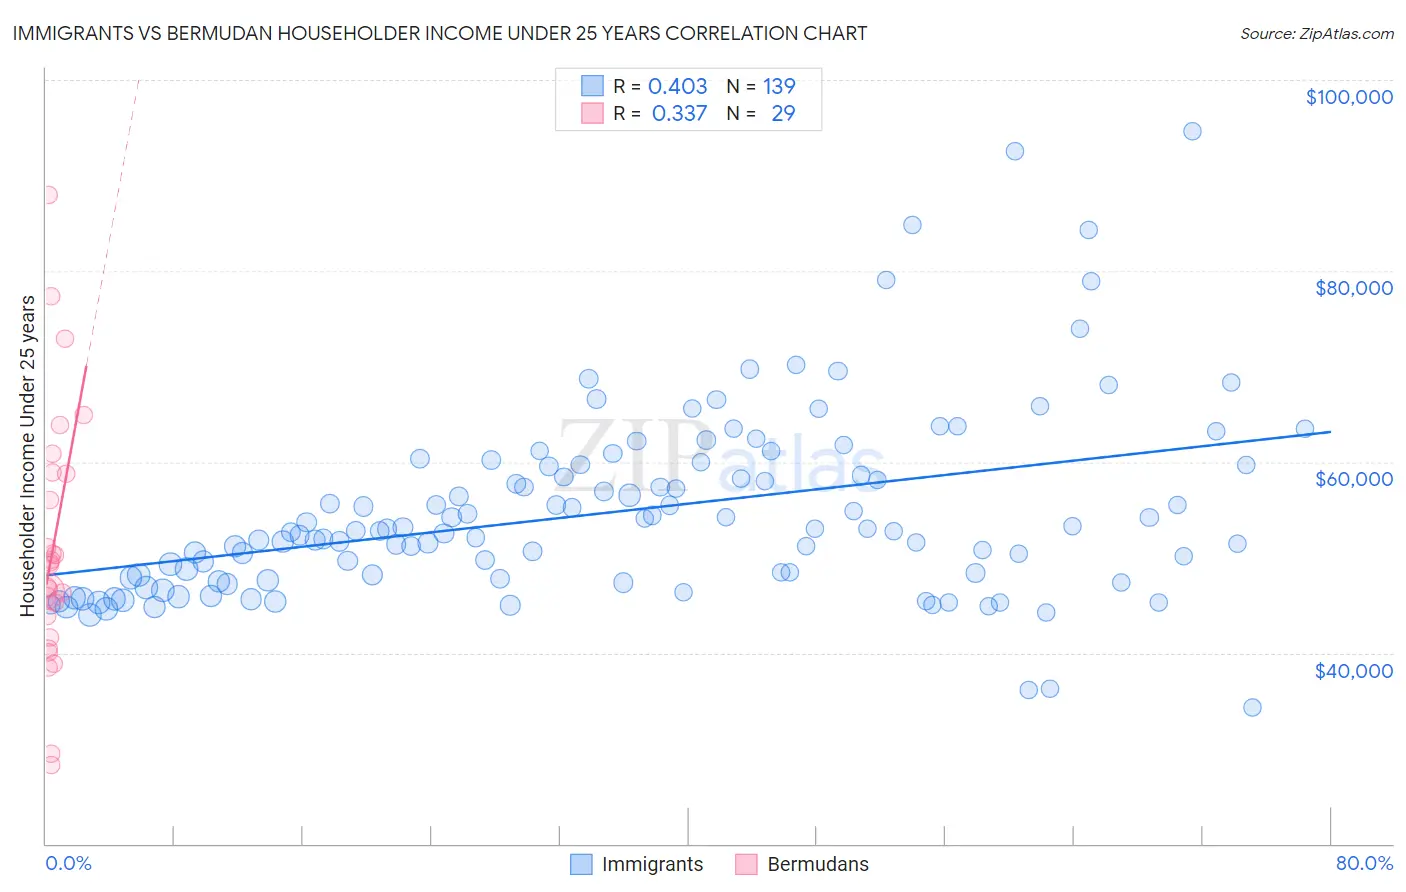
Immigrants vs Bermudan Householder Income Under 25 years Correlation Chart
The statistical analysis conducted on geographies consisting of 440,888,277 people shows a moderate positive correlation between the proportion of Immigrants and household income with householder under the age of 25 in the United States with a correlation coefficient (R) of 0.403 and weighted average of $53,201. Similarly, the statistical analysis conducted on geographies consisting of 52,946,816 people shows a mild positive correlation between the proportion of Bermudans and household income with householder under the age of 25 in the United States with a correlation coefficient (R) of 0.337 and weighted average of $47,359, a difference of 12.3%.
Householder Income Under 25 years Correlation Summary
| Measurement | Immigrants | Bermudan |
| Minimum | $34,271 | $28,306 |
| Maximum | $94,688 | $87,995 |
| Range | $60,417 | $59,689 |
| Mean | $54,792 | $51,037 |
| Median | $52,736 | $49,161 |
| Interquartile 25% (IQ1) | $47,750 | $42,763 |
| Interquartile 75% (IQ3) | $59,631 | $58,788 |
| Interquartile Range (IQR) | $11,881 | $16,024 |
| Standard Deviation (Sample) | $9,932 | $13,290 |
| Standard Deviation (Population) | $9,896 | $13,059 |
Similar Demographics by Householder Income Under 25 years
Demographics Similar to Immigrants by Householder Income Under 25 years
In terms of householder income under 25 years, the demographic groups most similar to Immigrants are Immigrants from Northern Africa ($53,185, a difference of 0.030%), Chilean ($53,185, a difference of 0.030%), Armenian ($53,179, a difference of 0.040%), Immigrants from Barbados ($53,163, a difference of 0.070%), and Moroccan ($53,256, a difference of 0.10%).
| Demographics | Rating | Rank | Householder Income Under 25 years |
| Immigrants | Serbia | 94.1 /100 | #126 | Exceptional $53,321 |
| Immigrants | North America | 93.9 /100 | #127 | Exceptional $53,307 |
| Immigrants | Bulgaria | 93.9 /100 | #128 | Exceptional $53,305 |
| New Zealanders | 93.7 /100 | #129 | Exceptional $53,294 |
| Nicaraguans | 93.4 /100 | #130 | Exceptional $53,275 |
| Immigrants | Nicaragua | 93.3 /100 | #131 | Exceptional $53,266 |
| Moroccans | 93.1 /100 | #132 | Exceptional $53,256 |
| Immigrants | Immigrants | 92.2 /100 | #133 | Exceptional $53,201 |
| Immigrants | Northern Africa | 91.9 /100 | #134 | Exceptional $53,185 |
| Chileans | 91.9 /100 | #135 | Exceptional $53,185 |
| Armenians | 91.8 /100 | #136 | Exceptional $53,179 |
| Immigrants | Barbados | 91.5 /100 | #137 | Exceptional $53,163 |
| Norwegians | 90.8 /100 | #138 | Exceptional $53,127 |
| Costa Ricans | 90.4 /100 | #139 | Exceptional $53,106 |
| Hawaiians | 89.8 /100 | #140 | Excellent $53,078 |
Demographics Similar to Bermudans by Householder Income Under 25 years
In terms of householder income under 25 years, the demographic groups most similar to Bermudans are Ottawa ($47,366, a difference of 0.010%), Iroquois ($47,380, a difference of 0.040%), U.S. Virgin Islander ($47,448, a difference of 0.19%), Comanche ($47,518, a difference of 0.34%), and Delaware ($47,159, a difference of 0.43%).
| Demographics | Rating | Rank | Householder Income Under 25 years |
| Cherokee | 0.0 /100 | #305 | Tragic $47,848 |
| Natives/Alaskans | 0.0 /100 | #306 | Tragic $47,704 |
| Bangladeshis | 0.0 /100 | #307 | Tragic $47,589 |
| Comanche | 0.0 /100 | #308 | Tragic $47,518 |
| U.S. Virgin Islanders | 0.0 /100 | #309 | Tragic $47,448 |
| Iroquois | 0.0 /100 | #310 | Tragic $47,380 |
| Ottawa | 0.0 /100 | #311 | Tragic $47,366 |
| Bermudans | 0.0 /100 | #312 | Tragic $47,359 |
| Delaware | 0.0 /100 | #313 | Tragic $47,159 |
| Chippewa | 0.0 /100 | #314 | Tragic $47,015 |
| Crow | 0.0 /100 | #315 | Tragic $47,012 |
| Sudanese | 0.0 /100 | #316 | Tragic $46,982 |
| Hopi | 0.0 /100 | #317 | Tragic $46,978 |
| Spanish Americans | 0.0 /100 | #318 | Tragic $46,913 |
| Africans | 0.0 /100 | #319 | Tragic $46,838 |