Immigrants from Zimbabwe vs Lebanese Median Male Earnings
COMPARE
Immigrants from Zimbabwe
Lebanese
Median Male Earnings
Median Male Earnings Comparison
Immigrants from Zimbabwe
Lebanese
$57,352
MEDIAN MALE EARNINGS
94.3/ 100
METRIC RATING
117th/ 347
METRIC RANK
$57,409
MEDIAN MALE EARNINGS
94.6/ 100
METRIC RATING
116th/ 347
METRIC RANK
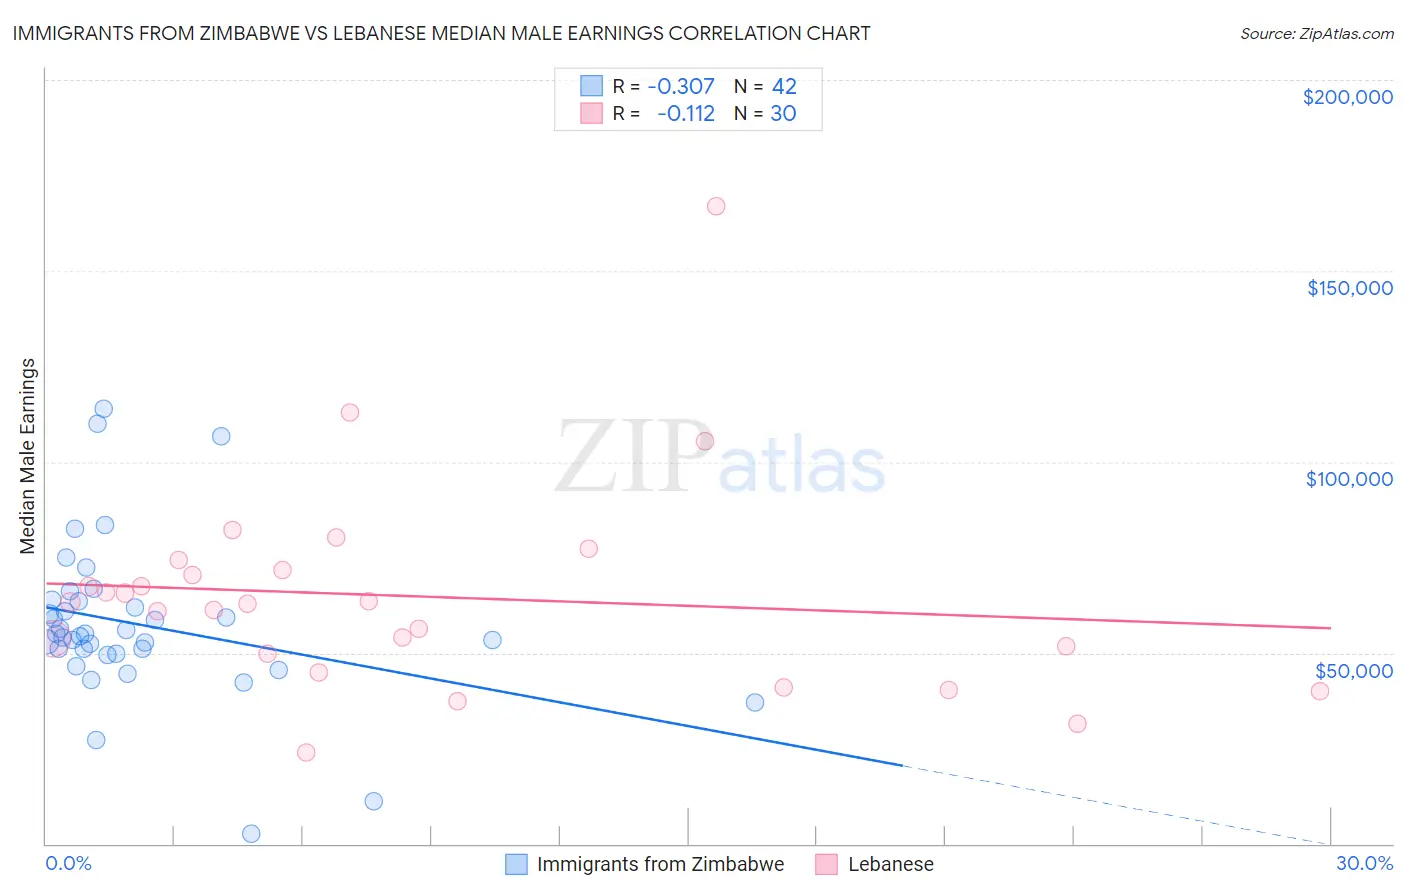
Immigrants from Zimbabwe vs Lebanese Median Male Earnings Correlation Chart
The statistical analysis conducted on geographies consisting of 117,801,711 people shows a mild negative correlation between the proportion of Immigrants from Zimbabwe and median male earnings in the United States with a correlation coefficient (R) of -0.307 and weighted average of $57,352. Similarly, the statistical analysis conducted on geographies consisting of 401,493,865 people shows a poor negative correlation between the proportion of Lebanese and median male earnings in the United States with a correlation coefficient (R) of -0.112 and weighted average of $57,409, a difference of 0.10%.
Median Male Earnings Correlation Summary
| Measurement | Immigrants from Zimbabwe | Lebanese |
| Minimum | $2,499 | $23,959 |
| Maximum | $113,981 | $167,014 |
| Range | $111,482 | $143,055 |
| Mean | $57,395 | $64,779 |
| Median | $54,601 | $62,976 |
| Interquartile 25% (IQ1) | $49,751 | $49,621 |
| Interquartile 75% (IQ3) | $63,542 | $71,843 |
| Interquartile Range (IQR) | $13,791 | $22,221 |
| Standard Deviation (Sample) | $21,107 | $27,382 |
| Standard Deviation (Population) | $20,855 | $26,922 |
Demographics Similar to Immigrants from Zimbabwe and Lebanese by Median Male Earnings
In terms of median male earnings, the demographic groups most similar to Immigrants from Zimbabwe are Hungarian ($57,309, a difference of 0.080%), Arab ($57,298, a difference of 0.090%), Canadian ($57,286, a difference of 0.12%), Swedish ($57,445, a difference of 0.16%), and Immigrants from Albania ($57,179, a difference of 0.30%). Similarly, the demographic groups most similar to Lebanese are Swedish ($57,445, a difference of 0.060%), Hungarian ($57,309, a difference of 0.18%), Arab ($57,298, a difference of 0.19%), Canadian ($57,286, a difference of 0.22%), and Immigrants from Kuwait ($57,562, a difference of 0.27%).
| Demographics | Rating | Rank | Median Male Earnings |
| Immigrants | Northern Africa | 96.9 /100 | #106 | Exceptional $58,008 |
| Serbians | 96.8 /100 | #107 | Exceptional $57,975 |
| Immigrants | Uzbekistan | 96.7 /100 | #108 | Exceptional $57,941 |
| British | 96.5 /100 | #109 | Exceptional $57,890 |
| Palestinians | 96.2 /100 | #110 | Exceptional $57,778 |
| Europeans | 95.6 /100 | #111 | Exceptional $57,637 |
| Immigrants | Afghanistan | 95.4 /100 | #112 | Exceptional $57,582 |
| Carpatho Rusyns | 95.3 /100 | #113 | Exceptional $57,572 |
| Immigrants | Kuwait | 95.3 /100 | #114 | Exceptional $57,562 |
| Swedes | 94.8 /100 | #115 | Exceptional $57,445 |
| Lebanese | 94.6 /100 | #116 | Exceptional $57,409 |
| Immigrants | Zimbabwe | 94.3 /100 | #117 | Exceptional $57,352 |
| Hungarians | 94.0 /100 | #118 | Exceptional $57,309 |
| Arabs | 94.0 /100 | #119 | Exceptional $57,298 |
| Canadians | 93.9 /100 | #120 | Exceptional $57,286 |
| Immigrants | Albania | 93.3 /100 | #121 | Exceptional $57,179 |
| Immigrants | Jordan | 93.1 /100 | #122 | Exceptional $57,145 |
| Slovenes | 93.1 /100 | #123 | Exceptional $57,145 |
| Chileans | 91.9 /100 | #124 | Exceptional $56,973 |
| Immigrants | Morocco | 91.8 /100 | #125 | Exceptional $56,958 |
| Chinese | 91.1 /100 | #126 | Exceptional $56,872 |