Immigrants from Zaire vs Icelander Median Male Earnings
COMPARE
Immigrants from Zaire
Icelander
Median Male Earnings
Median Male Earnings Comparison
Immigrants from Zaire
Icelanders
$47,070
MEDIAN MALE EARNINGS
0.1/ 100
METRIC RATING
299th/ 347
METRIC RANK
$55,415
MEDIAN MALE EARNINGS
71.2/ 100
METRIC RATING
157th/ 347
METRIC RANK
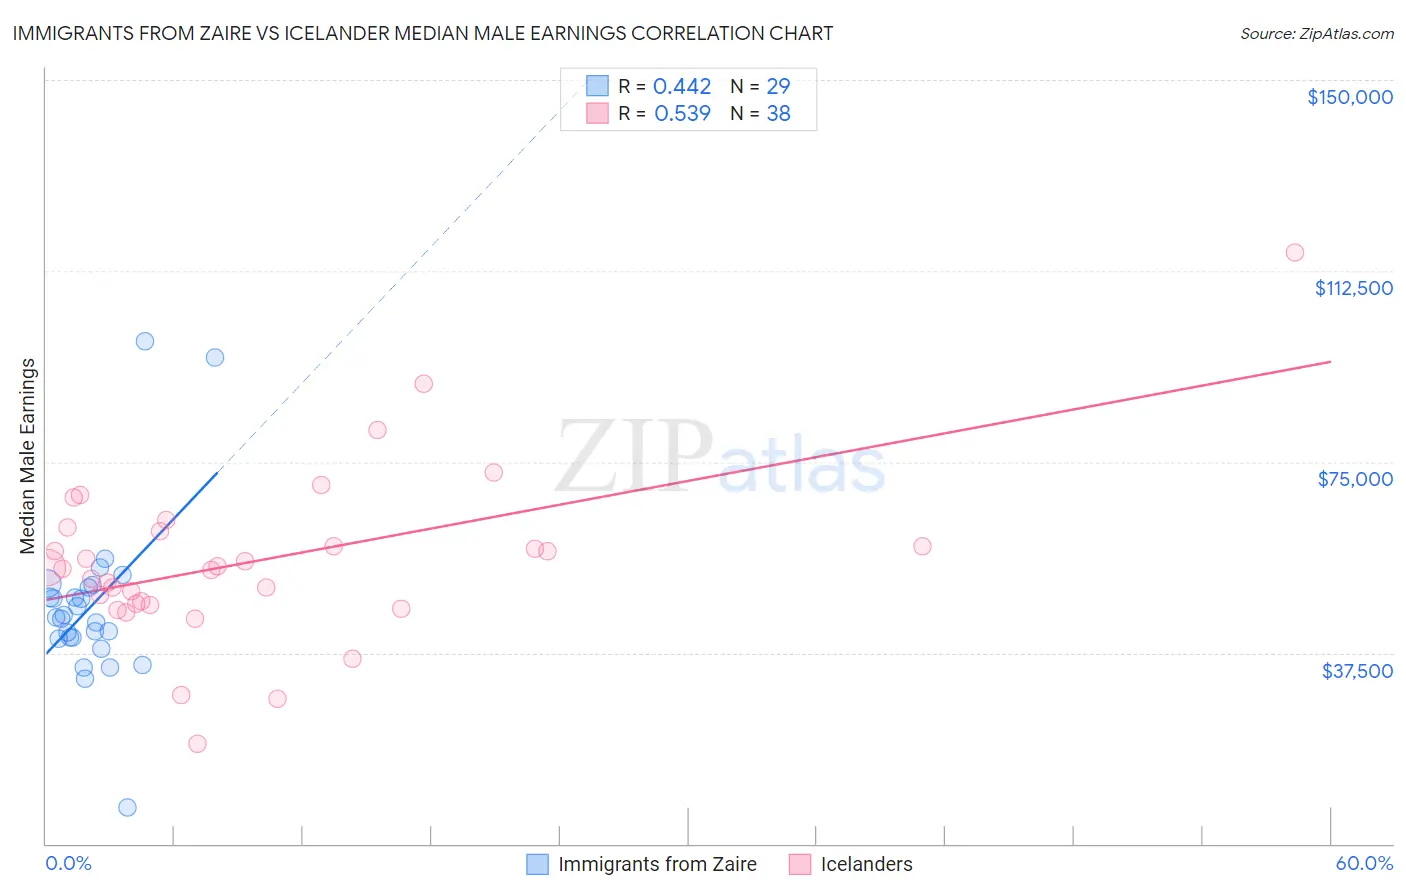
Immigrants from Zaire vs Icelander Median Male Earnings Correlation Chart
The statistical analysis conducted on geographies consisting of 107,252,506 people shows a moderate positive correlation between the proportion of Immigrants from Zaire and median male earnings in the United States with a correlation coefficient (R) of 0.442 and weighted average of $47,070. Similarly, the statistical analysis conducted on geographies consisting of 159,653,287 people shows a substantial positive correlation between the proportion of Icelanders and median male earnings in the United States with a correlation coefficient (R) of 0.539 and weighted average of $55,415, a difference of 17.7%.
Median Male Earnings Correlation Summary
| Measurement | Immigrants from Zaire | Icelander |
| Minimum | $7,065 | $19,583 |
| Maximum | $98,750 | $116,188 |
| Range | $91,685 | $96,605 |
| Mean | $46,699 | $55,596 |
| Median | $44,438 | $54,221 |
| Interquartile 25% (IQ1) | $40,386 | $47,034 |
| Interquartile 75% (IQ3) | $50,511 | $61,435 |
| Interquartile Range (IQR) | $10,125 | $14,401 |
| Standard Deviation (Sample) | $16,725 | $16,814 |
| Standard Deviation (Population) | $16,434 | $16,591 |
Similar Demographics by Median Male Earnings
Demographics Similar to Immigrants from Zaire by Median Male Earnings
In terms of median male earnings, the demographic groups most similar to Immigrants from Zaire are U.S. Virgin Islander ($47,066, a difference of 0.010%), Immigrants from Micronesia ($47,177, a difference of 0.23%), Dominican ($47,204, a difference of 0.28%), Immigrants from Latin America ($46,941, a difference of 0.28%), and Inupiat ($47,281, a difference of 0.45%).
| Demographics | Rating | Rank | Median Male Earnings |
| Immigrants | Dominica | 0.1 /100 | #292 | Tragic $47,651 |
| Indonesians | 0.1 /100 | #293 | Tragic $47,503 |
| Immigrants | Nicaragua | 0.1 /100 | #294 | Tragic $47,482 |
| Central American Indians | 0.1 /100 | #295 | Tragic $47,433 |
| Inupiat | 0.1 /100 | #296 | Tragic $47,281 |
| Dominicans | 0.1 /100 | #297 | Tragic $47,204 |
| Immigrants | Micronesia | 0.1 /100 | #298 | Tragic $47,177 |
| Immigrants | Zaire | 0.1 /100 | #299 | Tragic $47,070 |
| U.S. Virgin Islanders | 0.1 /100 | #300 | Tragic $47,066 |
| Immigrants | Latin America | 0.1 /100 | #301 | Tragic $46,941 |
| Seminole | 0.1 /100 | #302 | Tragic $46,783 |
| Yaqui | 0.1 /100 | #303 | Tragic $46,777 |
| Bangladeshis | 0.1 /100 | #304 | Tragic $46,744 |
| Guatemalans | 0.0 /100 | #305 | Tragic $46,736 |
| Dutch West Indians | 0.0 /100 | #306 | Tragic $46,656 |
Demographics Similar to Icelanders by Median Male Earnings
In terms of median male earnings, the demographic groups most similar to Icelanders are Immigrants from Ethiopia ($55,434, a difference of 0.030%), Czechoslovakian ($55,382, a difference of 0.060%), Alsatian ($55,380, a difference of 0.060%), Basque ($55,370, a difference of 0.080%), and Belgian ($55,361, a difference of 0.10%).
| Demographics | Rating | Rank | Median Male Earnings |
| Swiss | 77.1 /100 | #150 | Good $55,731 |
| Immigrants | Oceania | 76.8 /100 | #151 | Good $55,712 |
| Peruvians | 75.8 /100 | #152 | Good $55,659 |
| Immigrants | Nepal | 75.0 /100 | #153 | Good $55,615 |
| Taiwanese | 73.9 /100 | #154 | Good $55,556 |
| Scandinavians | 73.4 /100 | #155 | Good $55,527 |
| Immigrants | Ethiopia | 71.6 /100 | #156 | Good $55,434 |
| Icelanders | 71.2 /100 | #157 | Good $55,415 |
| Czechoslovakians | 70.5 /100 | #158 | Good $55,382 |
| Alsatians | 70.5 /100 | #159 | Good $55,380 |
| Basques | 70.3 /100 | #160 | Good $55,370 |
| Belgians | 70.1 /100 | #161 | Good $55,361 |
| French | 69.9 /100 | #162 | Good $55,350 |
| Ugandans | 68.6 /100 | #163 | Good $55,290 |
| Immigrants | South Eastern Asia | 67.6 /100 | #164 | Good $55,241 |