Immigrants from Western Europe vs Scottish Median Female Earnings
COMPARE
Immigrants from Western Europe
Scottish
Median Female Earnings
Median Female Earnings Comparison
Immigrants from Western Europe
Scottish
$41,990
MEDIAN FEMALE EARNINGS
99.2/ 100
METRIC RATING
91st/ 347
METRIC RANK
$38,397
MEDIAN FEMALE EARNINGS
6.3/ 100
METRIC RATING
227th/ 347
METRIC RANK
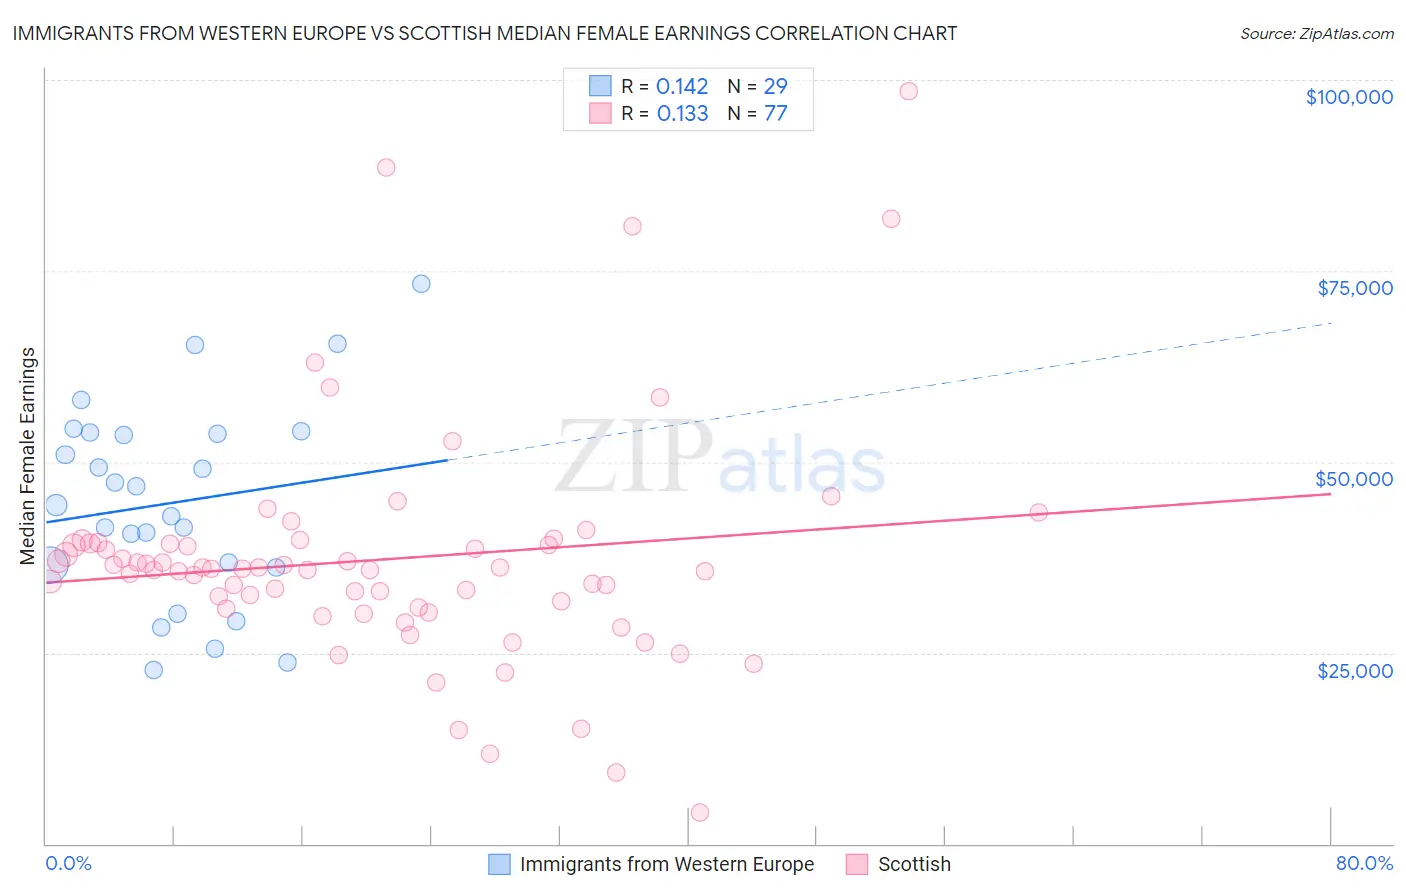
Immigrants from Western Europe vs Scottish Median Female Earnings Correlation Chart
The statistical analysis conducted on geographies consisting of 493,549,383 people shows a poor positive correlation between the proportion of Immigrants from Western Europe and median female earnings in the United States with a correlation coefficient (R) of 0.142 and weighted average of $41,990. Similarly, the statistical analysis conducted on geographies consisting of 565,316,168 people shows a poor positive correlation between the proportion of Scottish and median female earnings in the United States with a correlation coefficient (R) of 0.133 and weighted average of $38,397, a difference of 9.4%.
Median Female Earnings Correlation Summary
| Measurement | Immigrants from Western Europe | Scottish |
| Minimum | $22,777 | $4,115 |
| Maximum | $73,250 | $98,472 |
| Range | $50,473 | $94,357 |
| Mean | $44,663 | $37,218 |
| Median | $44,308 | $35,990 |
| Interquartile 25% (IQ1) | $36,403 | $30,914 |
| Interquartile 75% (IQ3) | $53,740 | $39,333 |
| Interquartile Range (IQR) | $17,337 | $8,419 |
| Standard Deviation (Sample) | $12,864 | $15,319 |
| Standard Deviation (Population) | $12,640 | $15,219 |
Similar Demographics by Median Female Earnings
Demographics Similar to Immigrants from Western Europe by Median Female Earnings
In terms of median female earnings, the demographic groups most similar to Immigrants from Western Europe are Ukrainian ($42,015, a difference of 0.060%), Argentinean ($41,952, a difference of 0.090%), Immigrants from Grenada ($41,932, a difference of 0.14%), Immigrants from Afghanistan ($42,055, a difference of 0.15%), and Immigrants from Northern Africa ($42,084, a difference of 0.22%).
| Demographics | Rating | Rank | Median Female Earnings |
| Armenians | 99.5 /100 | #84 | Exceptional $42,212 |
| Laotians | 99.4 /100 | #85 | Exceptional $42,133 |
| Immigrants | St. Vincent and the Grenadines | 99.3 /100 | #86 | Exceptional $42,108 |
| Lithuanians | 99.3 /100 | #87 | Exceptional $42,108 |
| Immigrants | Northern Africa | 99.3 /100 | #88 | Exceptional $42,084 |
| Immigrants | Afghanistan | 99.3 /100 | #89 | Exceptional $42,055 |
| Ukrainians | 99.2 /100 | #90 | Exceptional $42,015 |
| Immigrants | Western Europe | 99.2 /100 | #91 | Exceptional $41,990 |
| Argentineans | 99.1 /100 | #92 | Exceptional $41,952 |
| Immigrants | Grenada | 99.0 /100 | #93 | Exceptional $41,932 |
| Moroccans | 98.9 /100 | #94 | Exceptional $41,872 |
| Immigrants | Netherlands | 98.9 /100 | #95 | Exceptional $41,870 |
| South Africans | 98.8 /100 | #96 | Exceptional $41,825 |
| Immigrants | Hungary | 98.8 /100 | #97 | Exceptional $41,820 |
| Immigrants | Scotland | 98.7 /100 | #98 | Exceptional $41,771 |
Demographics Similar to Scottish by Median Female Earnings
In terms of median female earnings, the demographic groups most similar to Scottish are Subsaharan African ($38,391, a difference of 0.020%), Belgian ($38,382, a difference of 0.040%), French Canadian ($38,436, a difference of 0.10%), Basque ($38,352, a difference of 0.12%), and French ($38,457, a difference of 0.15%).
| Demographics | Rating | Rank | Median Female Earnings |
| Yugoslavians | 8.8 /100 | #220 | Tragic $38,573 |
| Immigrants | Azores | 8.8 /100 | #221 | Tragic $38,573 |
| Japanese | 8.1 /100 | #222 | Tragic $38,528 |
| Immigrants | Sudan | 7.8 /100 | #223 | Tragic $38,511 |
| Native Hawaiians | 7.1 /100 | #224 | Tragic $38,461 |
| French | 7.0 /100 | #225 | Tragic $38,457 |
| French Canadians | 6.8 /100 | #226 | Tragic $38,436 |
| Scottish | 6.3 /100 | #227 | Tragic $38,397 |
| Sub-Saharan Africans | 6.2 /100 | #228 | Tragic $38,391 |
| Belgians | 6.1 /100 | #229 | Tragic $38,382 |
| Basques | 5.7 /100 | #230 | Tragic $38,352 |
| Somalis | 5.5 /100 | #231 | Tragic $38,333 |
| Scandinavians | 5.2 /100 | #232 | Tragic $38,306 |
| Tongans | 5.1 /100 | #233 | Tragic $38,288 |
| Celtics | 5.0 /100 | #234 | Tragic $38,283 |