Immigrants from Western Europe vs Immigrants from Lebanon Householder Income Under 25 years
COMPARE
Immigrants from Western Europe
Immigrants from Lebanon
Householder Income Under 25 years
Householder Income Under 25 years Comparison
Immigrants from Western Europe
Immigrants from Lebanon
$52,957
HOUSEHOLDER INCOME UNDER 25 YEARS
86.7/ 100
METRIC RATING
145th/ 347
METRIC RANK
$50,729
HOUSEHOLDER INCOME UNDER 25 YEARS
2.7/ 100
METRIC RATING
240th/ 347
METRIC RANK
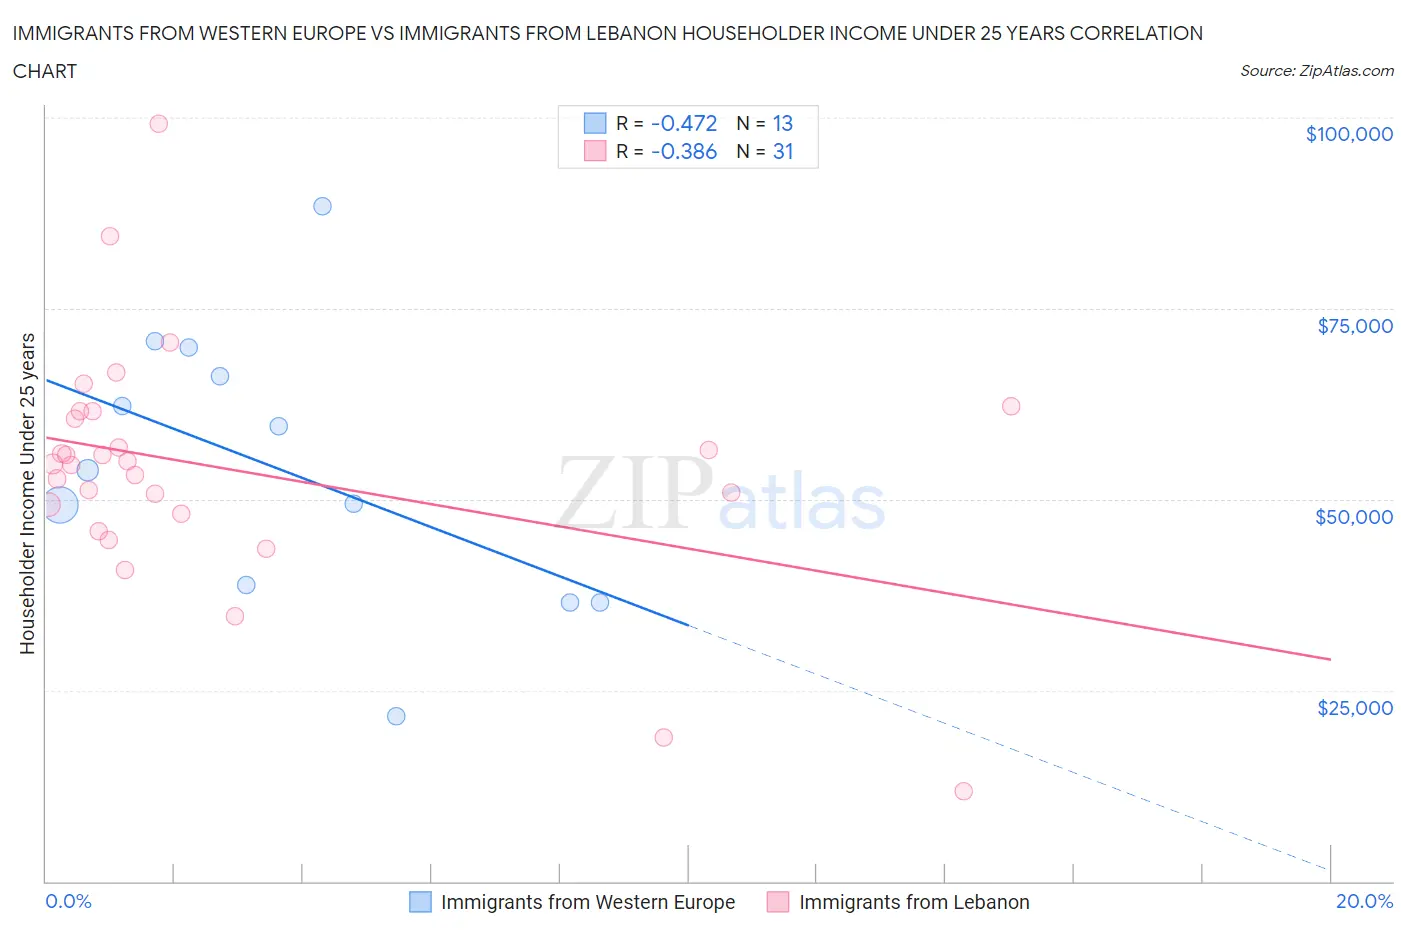
Immigrants from Western Europe vs Immigrants from Lebanon Householder Income Under 25 years Correlation Chart
The statistical analysis conducted on geographies consisting of 400,852,129 people shows a moderate negative correlation between the proportion of Immigrants from Western Europe and household income with householder under the age of 25 in the United States with a correlation coefficient (R) of -0.472 and weighted average of $52,957. Similarly, the statistical analysis conducted on geographies consisting of 191,197,334 people shows a mild negative correlation between the proportion of Immigrants from Lebanon and household income with householder under the age of 25 in the United States with a correlation coefficient (R) of -0.386 and weighted average of $50,729, a difference of 4.4%.
Householder Income Under 25 years Correlation Summary
| Measurement | Immigrants from Western Europe | Immigrants from Lebanon |
| Minimum | $21,627 | $11,835 |
| Maximum | $88,400 | $99,135 |
| Range | $66,773 | $87,300 |
| Mean | $54,075 | $53,966 |
| Median | $53,818 | $54,687 |
| Interquartile 25% (IQ1) | $37,651 | $48,163 |
| Interquartile 75% (IQ3) | $68,022 | $61,480 |
| Interquartile Range (IQR) | $30,371 | $13,317 |
| Standard Deviation (Sample) | $18,027 | $15,995 |
| Standard Deviation (Population) | $17,320 | $15,734 |
Similar Demographics by Householder Income Under 25 years
Demographics Similar to Immigrants from Western Europe by Householder Income Under 25 years
In terms of householder income under 25 years, the demographic groups most similar to Immigrants from Western Europe are South American Indian ($52,979, a difference of 0.040%), Immigrants from Armenia ($52,986, a difference of 0.050%), Swedish ($52,986, a difference of 0.050%), Danish ($53,041, a difference of 0.16%), and Hawaiian ($53,078, a difference of 0.23%).
| Demographics | Rating | Rank | Householder Income Under 25 years |
| Norwegians | 90.8 /100 | #138 | Exceptional $53,127 |
| Costa Ricans | 90.4 /100 | #139 | Exceptional $53,106 |
| Hawaiians | 89.8 /100 | #140 | Excellent $53,078 |
| Danes | 88.9 /100 | #141 | Excellent $53,041 |
| Immigrants | Armenia | 87.5 /100 | #142 | Excellent $52,986 |
| Swedes | 87.5 /100 | #143 | Excellent $52,986 |
| South American Indians | 87.3 /100 | #144 | Excellent $52,979 |
| Immigrants | Western Europe | 86.7 /100 | #145 | Excellent $52,957 |
| Immigrants | Hungary | 81.6 /100 | #146 | Excellent $52,798 |
| Latvians | 81.0 /100 | #147 | Excellent $52,783 |
| French Canadians | 76.5 /100 | #148 | Good $52,672 |
| Scandinavians | 75.7 /100 | #149 | Good $52,654 |
| Immigrants | Costa Rica | 75.2 /100 | #150 | Good $52,643 |
| Immigrants | Scotland | 75.0 /100 | #151 | Good $52,638 |
| Trinidadians and Tobagonians | 74.6 /100 | #152 | Good $52,631 |
Demographics Similar to Immigrants from Lebanon by Householder Income Under 25 years
In terms of householder income under 25 years, the demographic groups most similar to Immigrants from Lebanon are Immigrants from Caribbean ($50,757, a difference of 0.050%), Immigrants from Micronesia ($50,691, a difference of 0.080%), Iraqi ($50,802, a difference of 0.14%), English ($50,805, a difference of 0.15%), and German ($50,804, a difference of 0.15%).
| Demographics | Rating | Rank | Householder Income Under 25 years |
| Pennsylvania Germans | 3.7 /100 | #233 | Tragic $50,852 |
| Kenyans | 3.3 /100 | #234 | Tragic $50,815 |
| Spanish | 3.3 /100 | #235 | Tragic $50,813 |
| English | 3.3 /100 | #236 | Tragic $50,805 |
| Germans | 3.3 /100 | #237 | Tragic $50,804 |
| Iraqis | 3.2 /100 | #238 | Tragic $50,802 |
| Immigrants | Caribbean | 2.9 /100 | #239 | Tragic $50,757 |
| Immigrants | Lebanon | 2.7 /100 | #240 | Tragic $50,729 |
| Immigrants | Micronesia | 2.5 /100 | #241 | Tragic $50,691 |
| Cubans | 2.3 /100 | #242 | Tragic $50,655 |
| Immigrants | Thailand | 2.2 /100 | #243 | Tragic $50,645 |
| Marshallese | 2.1 /100 | #244 | Tragic $50,627 |
| Immigrants | Africa | 2.0 /100 | #245 | Tragic $50,609 |
| Welsh | 2.0 /100 | #246 | Tragic $50,597 |
| Immigrants | Bosnia and Herzegovina | 1.8 /100 | #247 | Tragic $50,565 |