Immigrants from Western Europe vs Immigrants from England Median Earnings
COMPARE
Immigrants from Western Europe
Immigrants from England
Median Earnings
Median Earnings Comparison
Immigrants from Western Europe
Immigrants from England
$50,549
MEDIAN EARNINGS
99.7/ 100
METRIC RATING
77th/ 347
METRIC RANK
$49,722
MEDIAN EARNINGS
99.0/ 100
METRIC RATING
95th/ 347
METRIC RANK
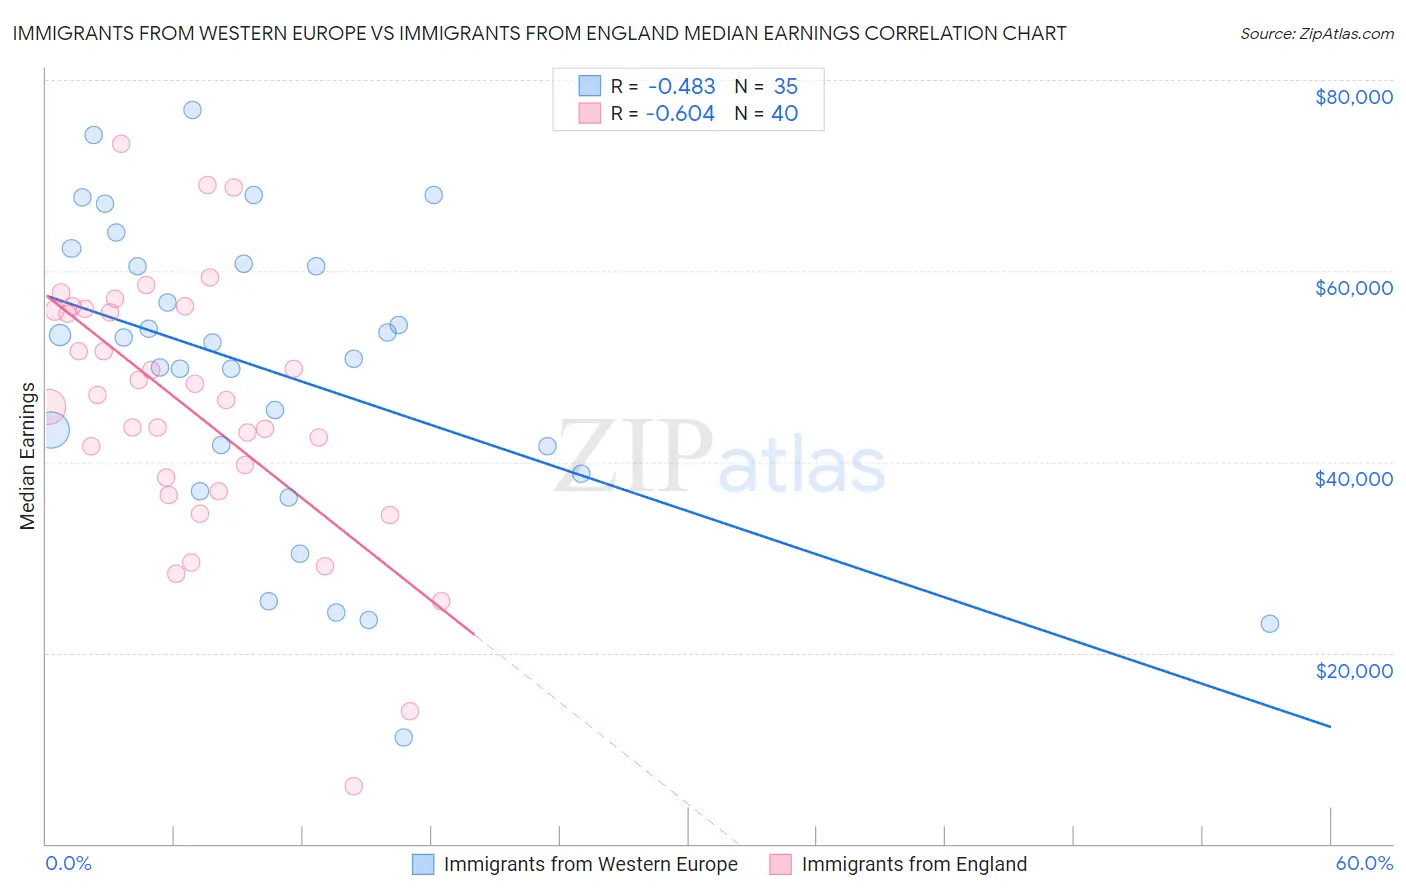
Immigrants from Western Europe vs Immigrants from England Median Earnings Correlation Chart
The statistical analysis conducted on geographies consisting of 493,982,841 people shows a moderate negative correlation between the proportion of Immigrants from Western Europe and median earnings in the United States with a correlation coefficient (R) of -0.483 and weighted average of $50,549. Similarly, the statistical analysis conducted on geographies consisting of 391,848,083 people shows a significant negative correlation between the proportion of Immigrants from England and median earnings in the United States with a correlation coefficient (R) of -0.604 and weighted average of $49,722, a difference of 1.7%.
Median Earnings Correlation Summary
| Measurement | Immigrants from Western Europe | Immigrants from England |
| Minimum | $11,184 | $5,997 |
| Maximum | $76,795 | $73,280 |
| Range | $65,611 | $67,283 |
| Mean | $49,401 | $45,709 |
| Median | $52,565 | $46,726 |
| Interquartile 25% (IQ1) | $38,750 | $37,678 |
| Interquartile 75% (IQ3) | $60,761 | $55,979 |
| Interquartile Range (IQR) | $22,011 | $18,301 |
| Standard Deviation (Sample) | $15,918 | $13,949 |
| Standard Deviation (Population) | $15,689 | $13,773 |
Demographics Similar to Immigrants from Western Europe and Immigrants from England by Median Earnings
In terms of median earnings, the demographic groups most similar to Immigrants from Western Europe are Immigrants from Italy ($50,581, a difference of 0.060%), Argentinean ($50,399, a difference of 0.30%), Laotian ($50,343, a difference of 0.41%), Ukrainian ($50,320, a difference of 0.45%), and Immigrants from Southern Europe ($50,280, a difference of 0.53%). Similarly, the demographic groups most similar to Immigrants from England are Croatian ($49,724, a difference of 0.0%), Immigrants from Lebanon ($49,682, a difference of 0.080%), Armenian ($49,804, a difference of 0.16%), Immigrants from Argentina ($49,841, a difference of 0.24%), and Macedonian ($49,893, a difference of 0.34%).
| Demographics | Rating | Rank | Median Earnings |
| Immigrants | Italy | 99.7 /100 | #76 | Exceptional $50,581 |
| Immigrants | Western Europe | 99.7 /100 | #77 | Exceptional $50,549 |
| Argentineans | 99.6 /100 | #78 | Exceptional $50,399 |
| Laotians | 99.6 /100 | #79 | Exceptional $50,343 |
| Ukrainians | 99.6 /100 | #80 | Exceptional $50,320 |
| Immigrants | Southern Europe | 99.6 /100 | #81 | Exceptional $50,280 |
| Immigrants | Moldova | 99.5 /100 | #82 | Exceptional $50,274 |
| Romanians | 99.5 /100 | #83 | Exceptional $50,244 |
| Immigrants | Hungary | 99.5 /100 | #84 | Exceptional $50,227 |
| Immigrants | Kazakhstan | 99.5 /100 | #85 | Exceptional $50,225 |
| Immigrants | Canada | 99.5 /100 | #86 | Exceptional $50,192 |
| Immigrants | Uzbekistan | 99.5 /100 | #87 | Exceptional $50,151 |
| Albanians | 99.4 /100 | #88 | Exceptional $50,116 |
| Immigrants | North America | 99.4 /100 | #89 | Exceptional $50,108 |
| Italians | 99.3 /100 | #90 | Exceptional $49,915 |
| Macedonians | 99.2 /100 | #91 | Exceptional $49,893 |
| Immigrants | Argentina | 99.2 /100 | #92 | Exceptional $49,841 |
| Armenians | 99.1 /100 | #93 | Exceptional $49,804 |
| Croatians | 99.0 /100 | #94 | Exceptional $49,724 |
| Immigrants | England | 99.0 /100 | #95 | Exceptional $49,722 |
| Immigrants | Lebanon | 99.0 /100 | #96 | Exceptional $49,682 |